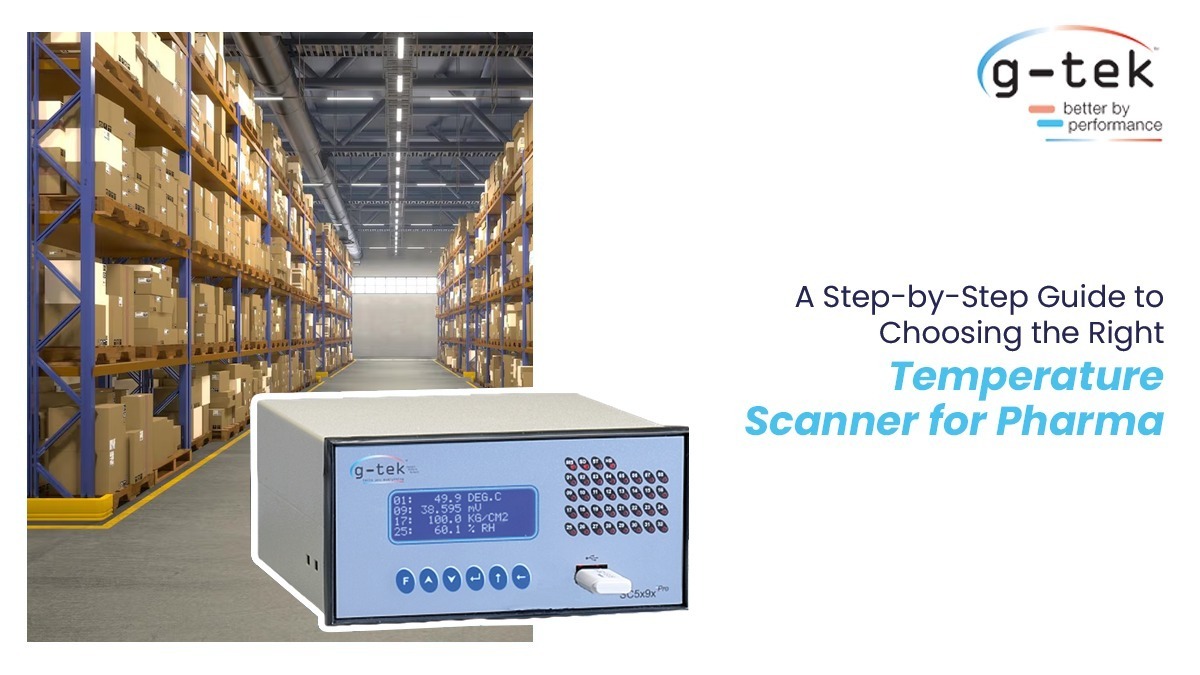
Temperature Monitoring Can Make or Break Your Pharma Compliance Temperature monitoring in pharma isn’t just…
Temperature Monitoring in 2026: Avoid Missing Critical Excursions by Selecting the Right Chart Range
If you are managing a blood bank, one thing is non-negotiable: clear and complete temperature records.
Yet many monitoring setups still face a silent issue not because the recorder fails, but because the chart range is not correctly selected. In 2026, this can directly impact traceability, audit clarity, and validation outcomes.
Why Chart Range Selection Is More Critical Than It Seems
Blood storage environments involve more than just refrigeration. From controlled storage to handling at room temperature, temperature movement is part of the process.
However, when chart ranges such as -10°C to +40°C are selected without considering visibility, the recorded trace may not clearly show these variations.
This leads to:
- Reduced visibility of minor excursions
- Difficulty identifying transitions between storage and room temperature
- Charts that require effort to interpret instead of providing instant clarity
For QA/QC, validation teams, and management, this affects how confidently data can be reviewed during audits.
Where the Gap Becomes Visible
During audits or internal reviews, charts are expected to provide quick and clear insight into temperature behaviour.
If the selected chart range is not aligned with actual conditions, the trace may appear compressed. As a result:
- Excursions are not immediately visible
- Interpretation becomes time-consuming
- Audit discussions rely more on explanation than clear evidence
In critical environments like blood banks, data should speak clearly without interpretation gaps.
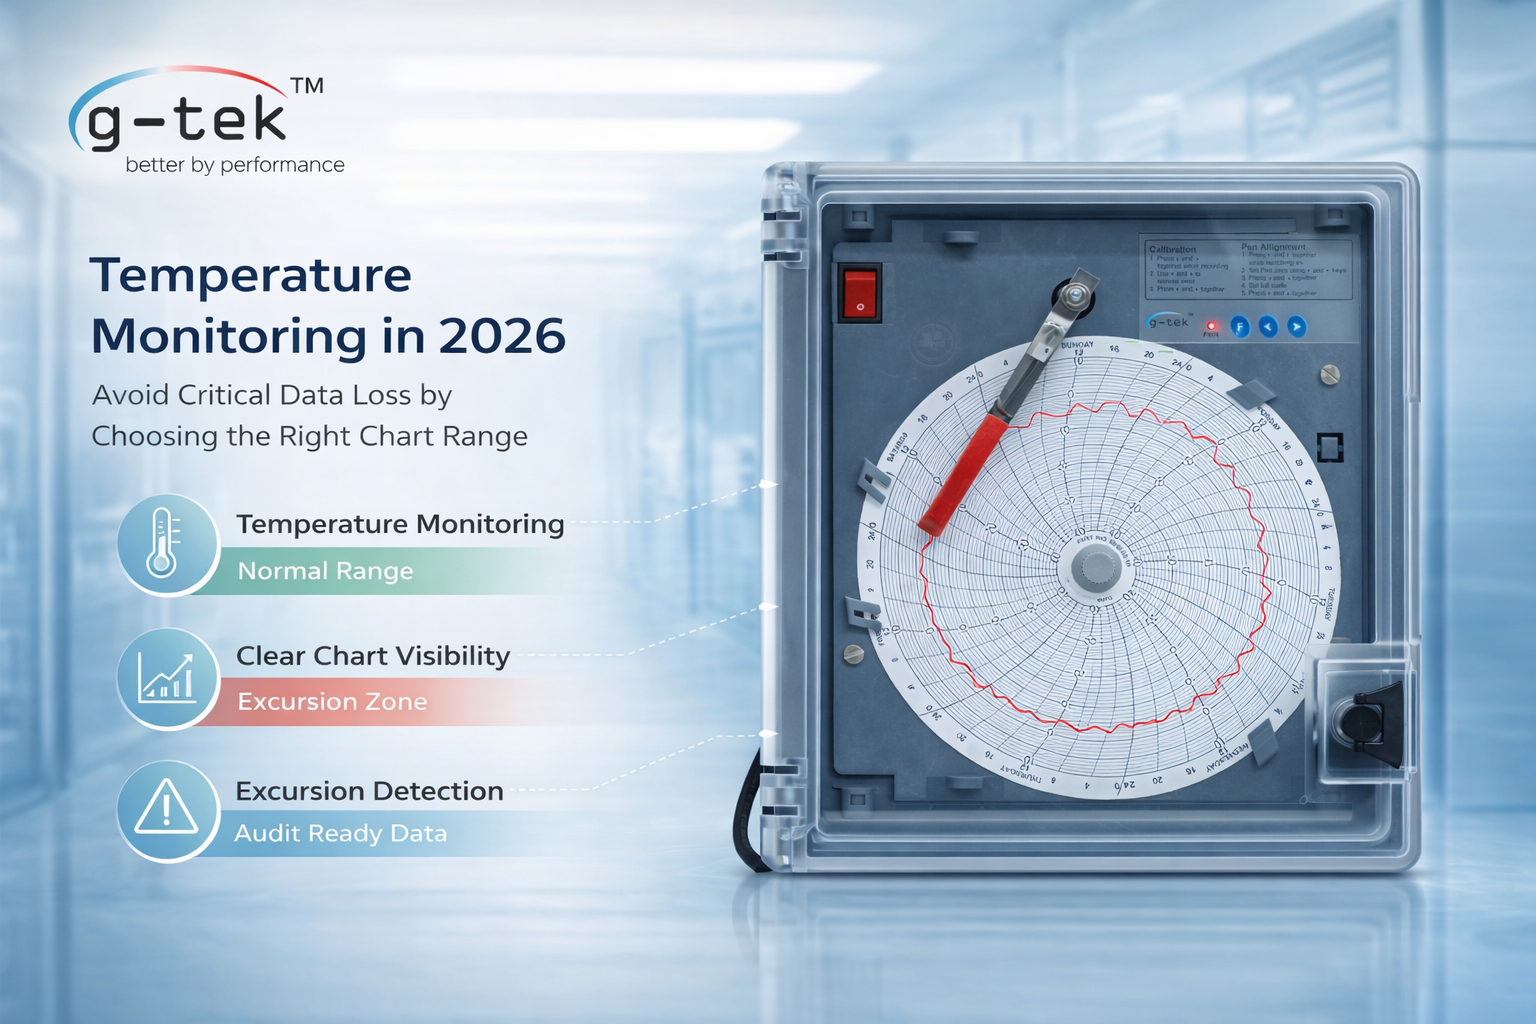
The Right Approach: Focus on Range and Visibility Band
Effective temperature monitoring is not just about recording—it is about how clearly the data is presented.
Using chart ranges such as:
- -10°C to +40°C
- -100°C to +50°C
ensures that both storage conditions and room temperature exposure are captured.
More importantly, selecting the correct range band helps:
- Identify excursions instantly
- Clearly distinguish normal vs. deviation zones
- Improve audit-readiness and decision-making
This is especially important during movement between cold storage and room temperature, where visibility is critical.
How Circular Chart Recorders Support This
When circular chart recorders are configured with appropriate chart ranges and bands, they enable:
- Continuous temperature monitoring
- Clear and readable temperature traces
- Complete and audit-ready documentation
This allows QA, validation, and management teams to review data with clarity and confidence.
Next Step
Ready to improve visibility and traceability in your blood bank monitoring process? Schedule a 1-1 meeting with our experts at Gtek today to explore circular chart recorders with optimized chart ranges and visibility bands—so your temperature records remain clear, continuous, and easy to interpret in every situation.
Related Posts