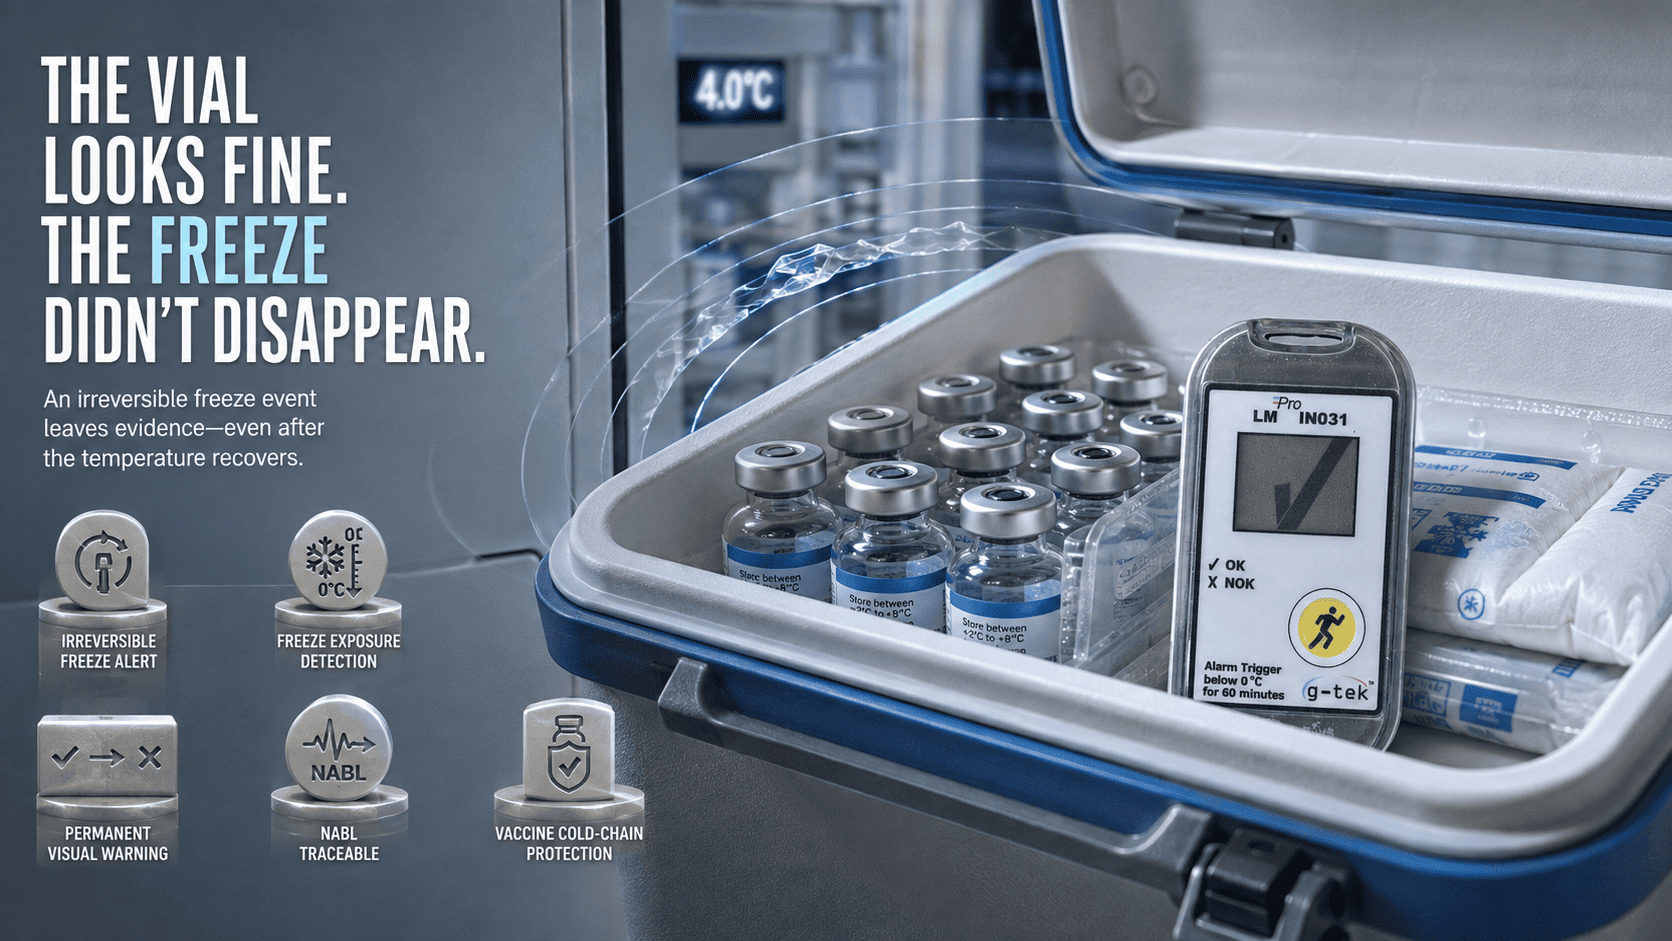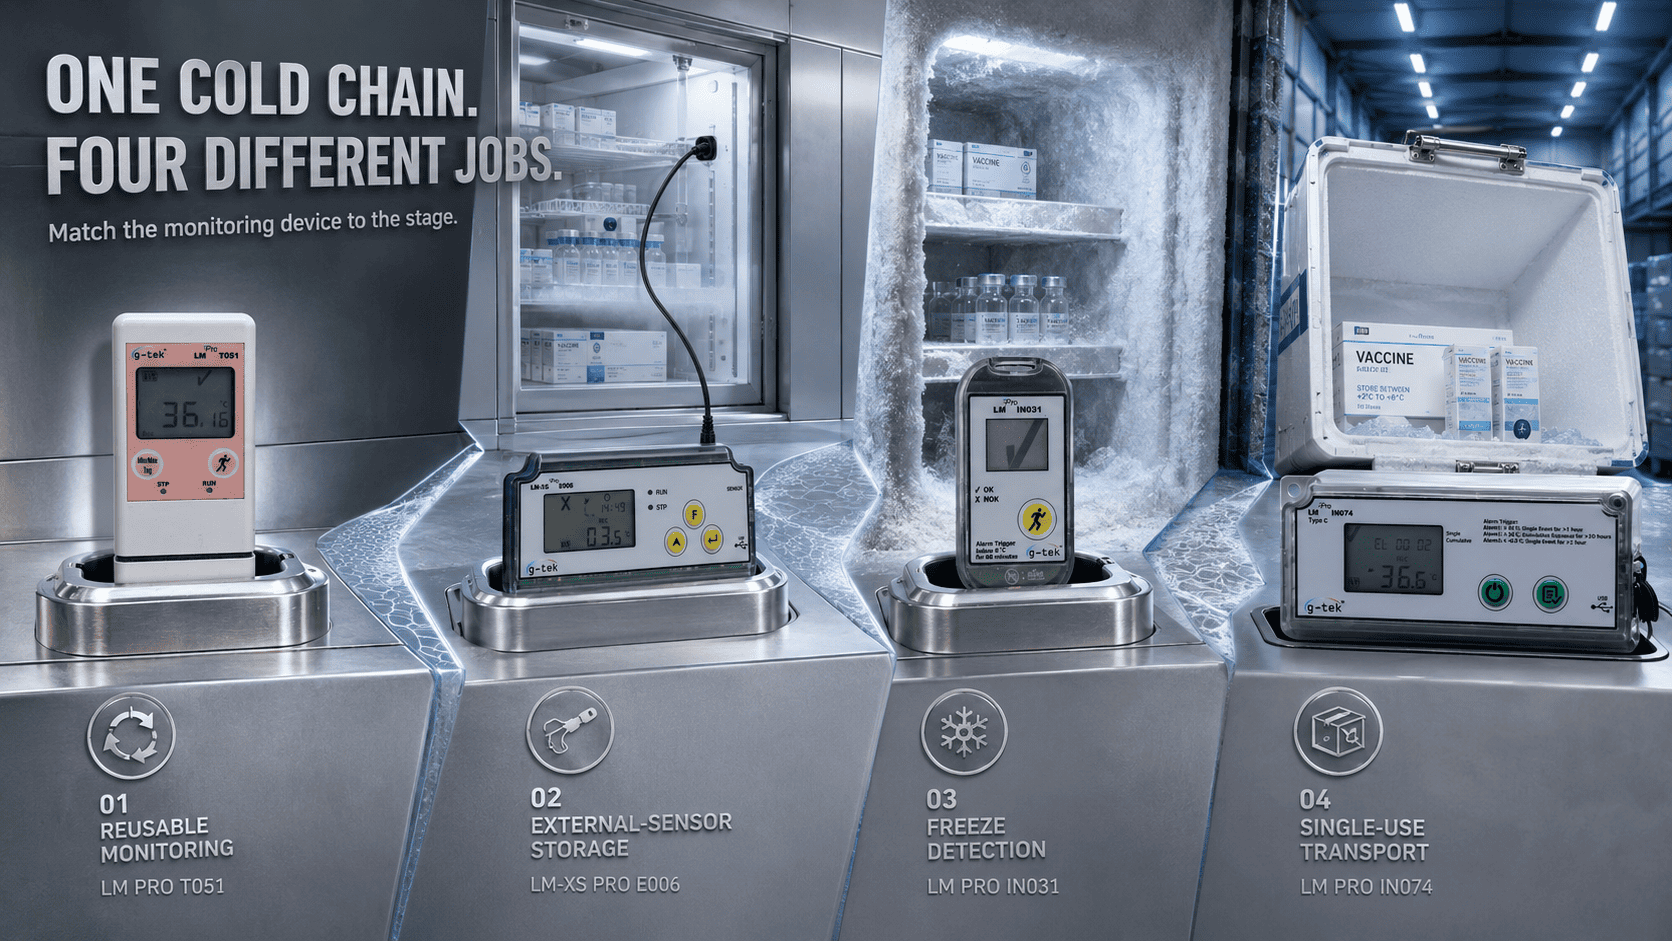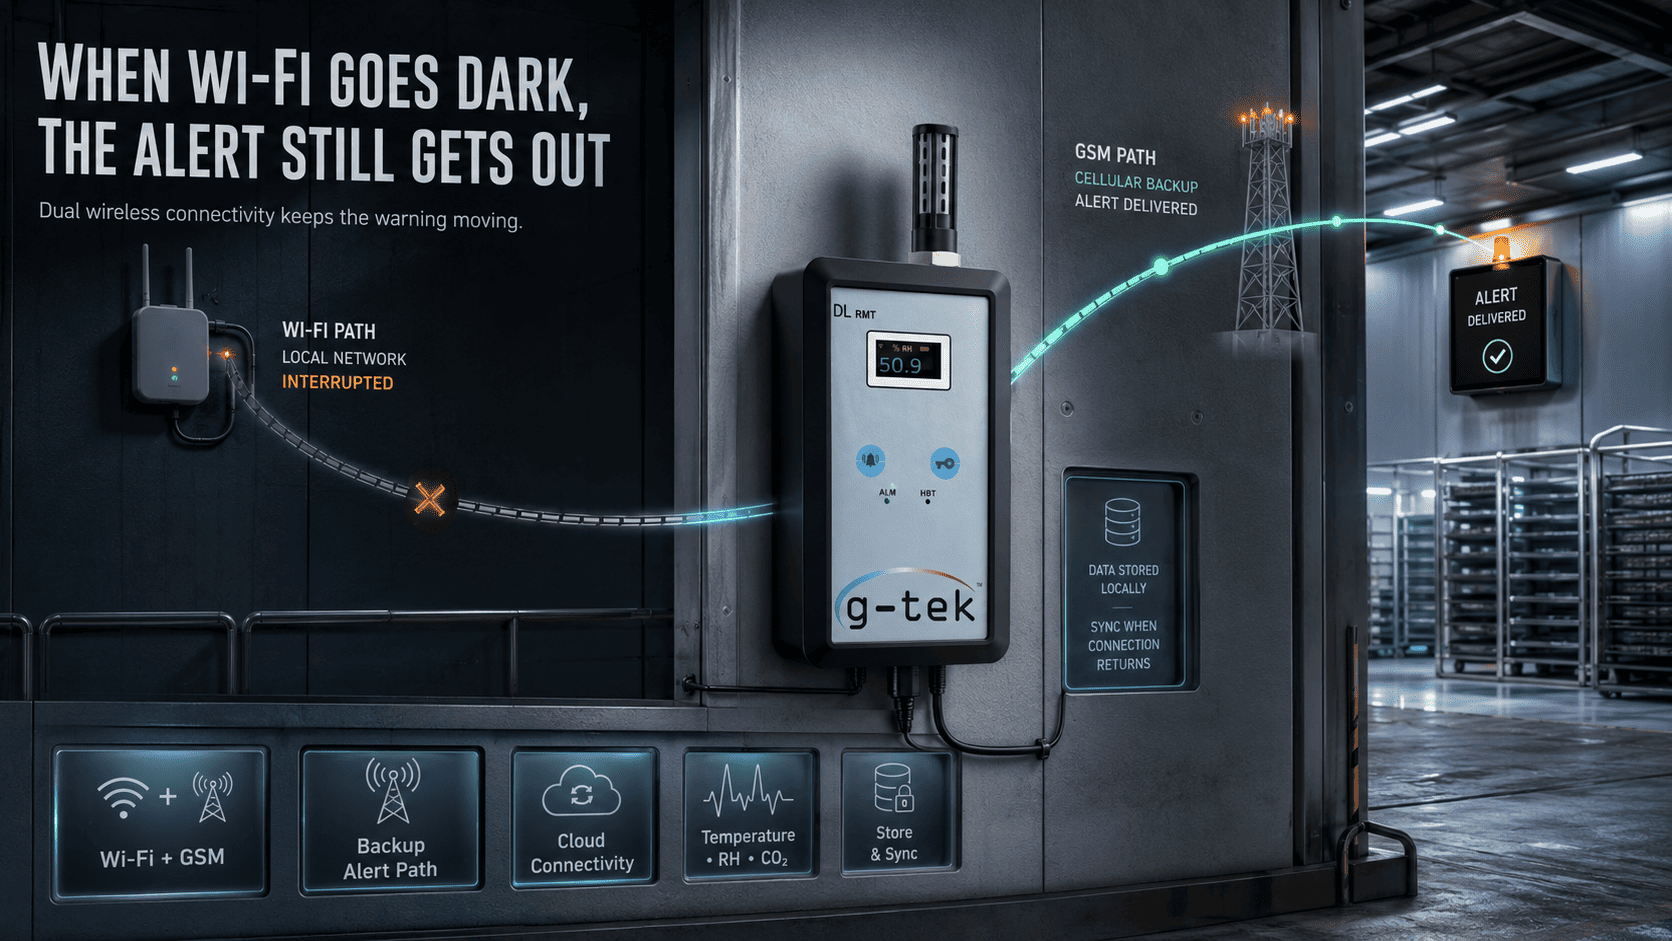
A health worker lifts a vial from the cold box. It reads 4°C. It's clear…
The Cold Spot That Passes in Winter and Fails in Summer – What Thermal Mapping Really Demands in 2026
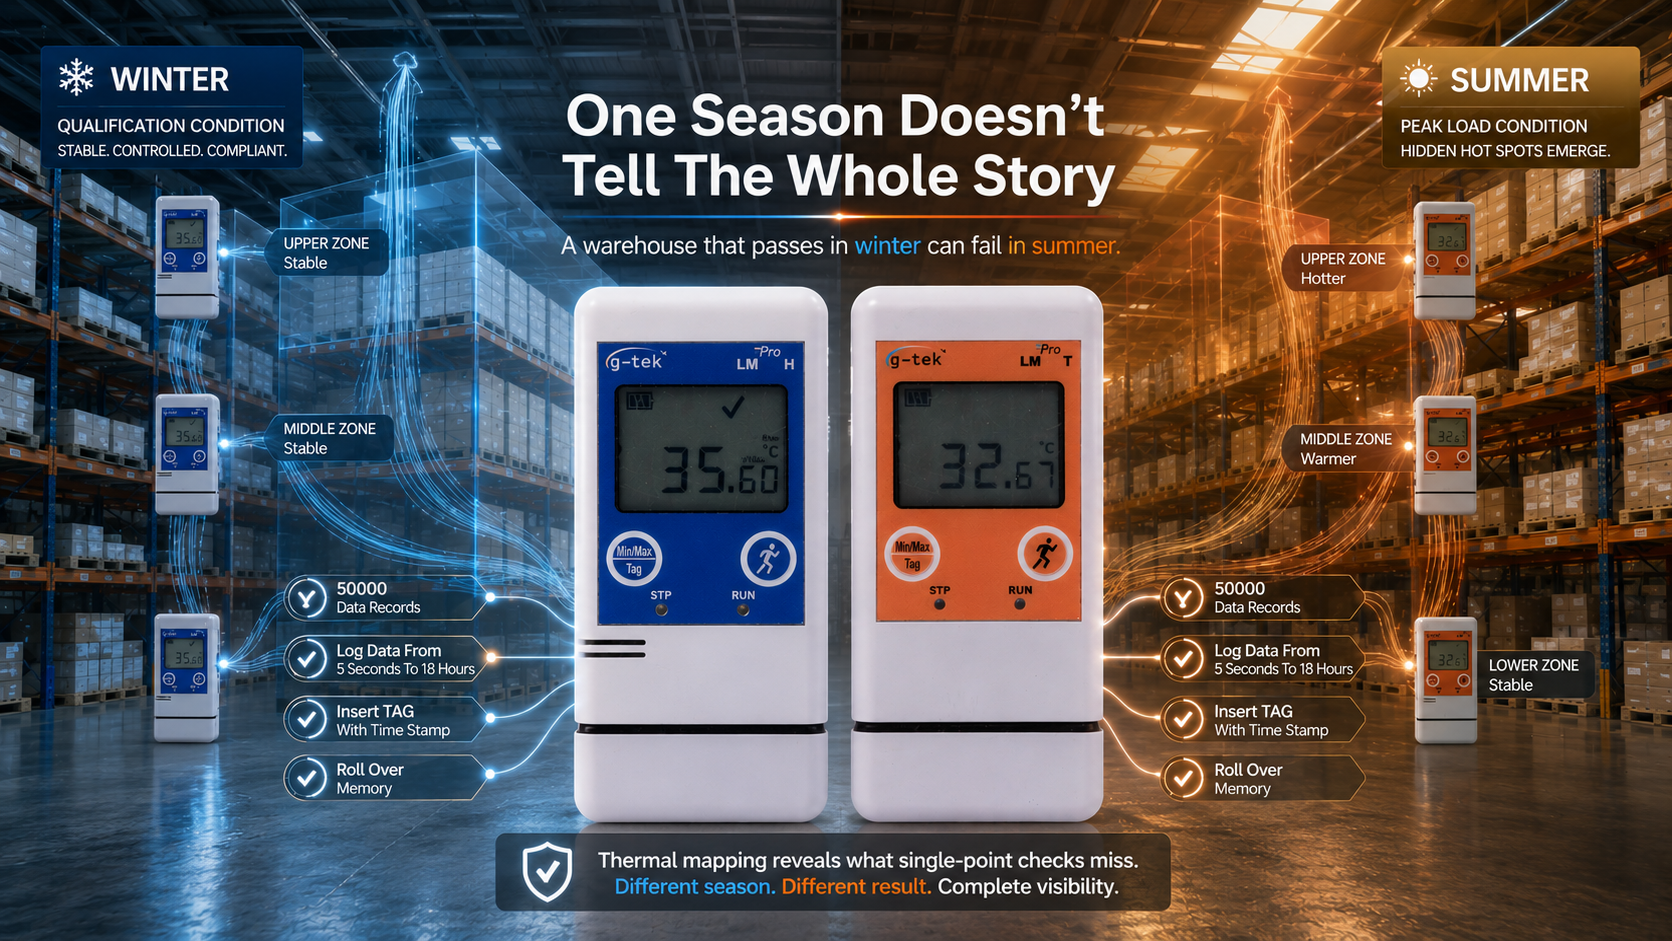
Your warehouse passed mapping in October. Mild weather, clean data, every signature in place. Then May arrives, the roof bakes, and the upper racks — holding live product — drift out of range.
In peak summer, warehouses built with profiled metal roofing rather than insulated concrete absorb significantly more radiant heat — and one facility watched its upper storage zones drift out of range until the cooling distribution was re-balanced. The pattern stayed invisible until the mapping study ran through the hottest months.
Here’s what changed. In 2026, a thermal mapping study done in one season no longer satisfies auditors. WHO and USFDA inspectors expect mapping that captures worst-case conditions — peak summer and deep winter — across enough points to prove every zone holds temperature, not just the spot beside the sensor.
🎯
Key Takeaways
- Thermal mapping proves temperature uniformity across an entire space — not just at one control point
- A study run in mild weather can hide hot and cold spots that surface only in peak summer or deep winter
- WHO guidance expects mapping in worst-case seasons, with enough sensors to cover the full volume
- Sensor count scales with space — from around 9 points in a small chamber to dozens across a warehouse
- One consolidated report across every logger beats stitching separate PDFs together by hand
What Is Thermal Mapping and Why Isn’t One Sensor Enough?
Thermal mapping is a documented study that measures how temperature and often humidity is distributed across a storage space, using multiple sensors recording together over time.
One control sensor only knows its own spot. It can’t see the corner that traps heat, the door that bleeds cold on every opening, or the top rack nearest a sun-loaded roof. That’s how a space passes in October and drifts out of range in May — the variation was always there, just never measured where it mattered.
How Many Sensors, and for How Long, Does a Proper Study Need?
Sensor count scales with volume — roughly nine in a small chamber, rising to fifteen or more, even dozens, across a warehouse — placed at corners, centre, doors, and varying heights. Duration runs 24–72 hours for chambers, often 7 days for warehouses, and the study must run in worst-case seasons, per WHO TRS 961, Annex 9 and its temperature-mapping technical supplement.
At one leading Indian pharmaceutical facility, the mapping protocol keeps loggers running in a storage room for up to six months — because the team established that hot and cold points are not fixed. A location that mapped within range early can drift later, so sensors are repositioned at the newly identified points and the study repeated to confirm true year-round uniformity.
How G-Tek Turns a Multi-Point Mapping Study Into One Clean
Making monitoring instruments in Vadodara since 1990, G-Tek Corporation builds the portable LM Pro T and LM Pro H loggers used to map storage spaces point by point — then brings every logger together in LmView, which compiles an entire study into one consolidated report. One validation services provider running fifty loggers reported pulling reports in groups of five, fifteen, or all fifty at once, by choice, instead of reconciling each logger separately. Every logger carries a calibration certificate from G-Tek’s own NABL ISO/IEC 17025-accredited laboratory, matched to the temperature range being mapped — the detail that keeps a validation protocol from being rejected on scope. It’s the mapping toolkit validation teams at Sun Pharma, Cipla, and Aurobindo already work with.
Explore the G-Tek LM Pro data logger range, and the NABL calibration lab. Mapping methodology follows the WHO Temperature Mapping Technical Supplement.
Map It Once, Defend It in Every Season
If a qualification is coming up and the last mapping study only ever saw one season, the gaps are still there — waiting for an inspector to find them. The fix is a study built for worst-case conditions and documented in one clean report.
👉 Bring the G-Tek team in to scope your next mapping study — the right sensor layout, the worst-case seasons, and one consolidated report your auditor will accept.
Frequently Asked Questions
What is thermal mapping in pharma storage?
A documented study measuring temperature and humidity distribution across a storage space using multiple sensors over time proving every zone holds the required condition, not just the point near the control sensor.
How many sensors does a thermal mapping study need?
Count scales with volume roughly nine in a small chamber, rising to fifteen or more across a large warehouse placed at corners, centre, doors, and varying heights to capture true distribution.
Why must mapping be done in both summer and winter?
A study run in mild weather can miss hot and cold spots that appear only in peak summer or deep winter. WHO guidance expects mapping under worst-case seasonal conditions.
Which G-Tek product is used for thermal mapping?
G-Tek’s portable LM Pro T and LM Pro H loggers, paired with LmView software, map a space point by point and compile every logger into one consolidated, NABL-traceable report.
Where is G-Tek Corporation located?
G-Tek Corporation is headquartered in Vadodara, Gujarat, manufacturing monitoring instruments since 1990, with an in-house NABL ISO/IEC 17025-accredited calibration laboratory and pan-India support.
Related Posts