By Asutosh Shah & Alpesh Shah · Founders, G-Tek Corporation. 30+ years in temperature monitoring,…
How to Actually Read a Circular Chart and Spot the Problems Hiding in the Line
By Asutosh Shah & Alpesh Shah · Founders, G-Tek Corporation. 30+ years in temperature monitoring, recording, and calibration instrumentation.
Be honest: when you glance at the chart recorder on the wall, are you reading it or just checking the pen is still moving? Most people do the second. And that’s how a slow drift over three weeks, or a spike at the same time every night, sits in plain sight on the chart for months before anyone recognises what it means. Here’s how to read a circular chart properly.
Reading a circular chart means checking three things: where the line sits against the temperature scale, how steady it is across the rotation, and whether any repeating pattern (spikes, cycling, or a slow drift) signals a real problem developing.
🎯 Key Takeaways
- The pen’s distance from the centre shows temperature; the disc’s rotation shows time
- A healthy trace stays steady and within the expected band across the full rotation
- Regular spikes at the same hour usually point to door openings or a defrost cycle
- A slowly rising or widening line can mean equipment gradually losing performance
- Learning to read the pattern catches issues weeks before they turn into findings
Every chart tells you two things at once: temperature and time
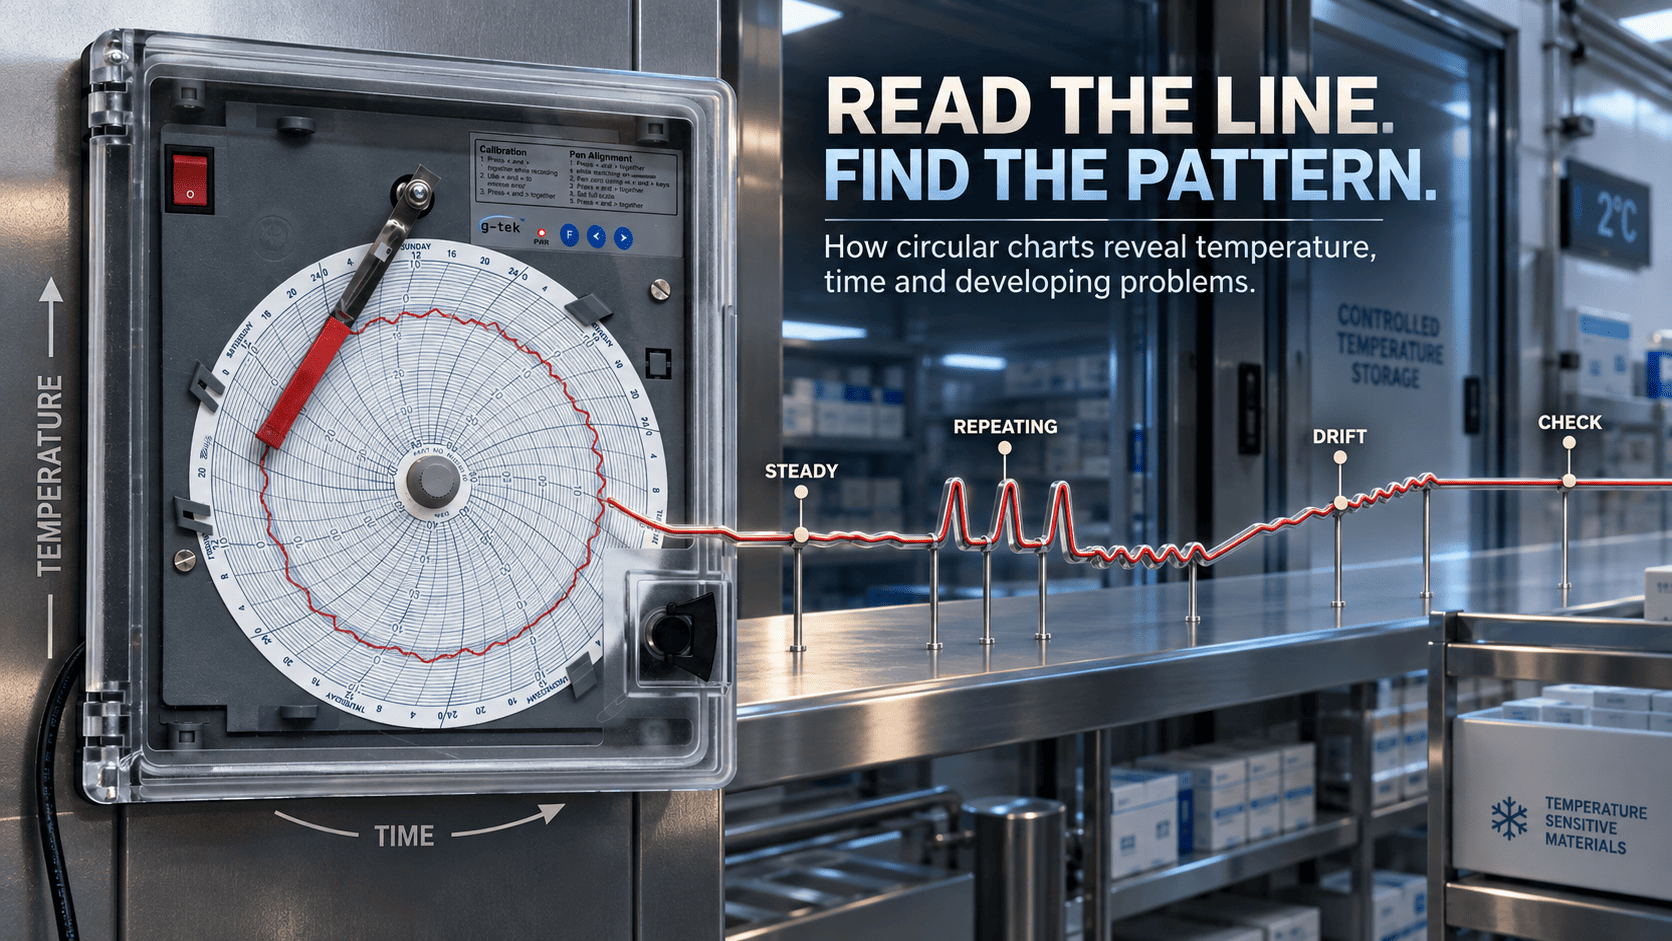
On a circular chart, the pen’s position outward from the centre shows the temperature against the printed scale, while the disc’s rotation shows the time, so a single point on the line tells you what the temperature was at a specific moment.
To read a circular chart, start by orienting yourself. First, find the printed temperature rings. Confirm whether the chart is a 24-hour or 7-day rotation. Then read any point as two coordinates: how far out, and how far around.
That trace comes from a sensor. In most circular chart recorders, that’s an RTD Pt-100 element behaving to IEC 60751. The line is only as honest as the element driving it.
When you read a circular chart, look for the pattern, not just the position
Read the shape of the line, not only where it sits. A steady trace within band is healthy, while repeating spikes, tight cycling, or a gradual drift each point to a different underlying issue.
Regular spikes at the same time: door openings, a defrost cycle, or scheduled activity. Consistent timing is your clue it’s routine.
Tight repeated cycling: the unit is working harder to hold setpoint. Worth checking before it stops holding.
Slow drift up or down: gradual performance decline. This is the pattern people miss, because no single day looks wrong.
A flat, unchanging line: and here’s where most readers relax. They shouldn’t.
What if the line looks fine but something still went wrong?
If a chart looks fine but a problem occurred, the likely reasons are that the recorder measured only one location while the issue happened elsewhere, or the pen or sensor failed, which is why a flat, unvarying line deserves as much suspicion as a wild one.
After all, one recorder watches one point. If the cold spot sits three metres away, the chart stays clean. Facilities needing multiple points often pair the recorder with data loggers placed across the space.
This is also why the recorder itself has to hold up. G-Tek Corporation, building circular chart recorders in Vadodara for over 30 years, makes its range with accurate RTD Pt-100 sensing and maintenance-free pens that keep tracing cleanly without ink failures, so the line you’re reading reflects what actually happened. Additionally, every unit is traceable to G-Tek’s own NABL ISO/IEC 17025-accredited calibration laboratory, keeping the record legible, original and attributable the way ALCOA+ expects during GMP or blood bank record review.
A Circular Chart Is Only Useful If Someone Can Read It Properly
Learning to read the pattern turns a chart from wall decoration into an early warning system. And that only works if the recorder tracing the line is accurate and traceably calibrated.
👉 Unsure whether your chart recorder’s trace can be trusted? Share your setup with the G-Tek team, and get a clear view of the recorder and calibration your records deserve.
Frequently Asked Questions
How do you read a circular chart recorder?
The pen’s distance from the centre gives temperature against the printed scale; the disc’s rotation gives time. Any point on the line reads as both together.
What do regular spikes on a chart mean?
Spikes at the same hour daily usually indicate a recurring event: door openings, defrost, or scheduled activity. Consistent timing signals routine rather than random.
When you read a circular chart, is a completely flat line a good sign?
Not necessarily. A perfectly unvarying trace can indicate a stuck pen or failed sensor, so it deserves checking as much as an erratic one.
Why might a problem not show on the chart?
A recorder measures one location. If the issue occurred elsewhere in the space, the chart looks normal, which is why sensor placement matters.
Where is G-Tek Corporation located?
Vadodara, Gujarat, manufacturing recording and monitoring instruments for over 30 years, with an in-house NABL ISO/IEC 17025-accredited calibration laboratory and pan-India support.
Related Posts