By Asutosh Shah & Alpesh Shah · Founders, G-Tek Corporation · 30+ years in temperature…
Circular Chart Recorder Chart Speed: 24-Hour, 7-Day, or 31-Day?

By Asutosh Shah & Alpesh Shah · Founders, G-Tek Corporation · 30+ years in temperature monitoring, recording, and calibration instrumentation.
A chart is just paper. Pick any rotation, change it when it fills up, and let the recorder handle the rest.
That assumption quietly decides what your record can prove.
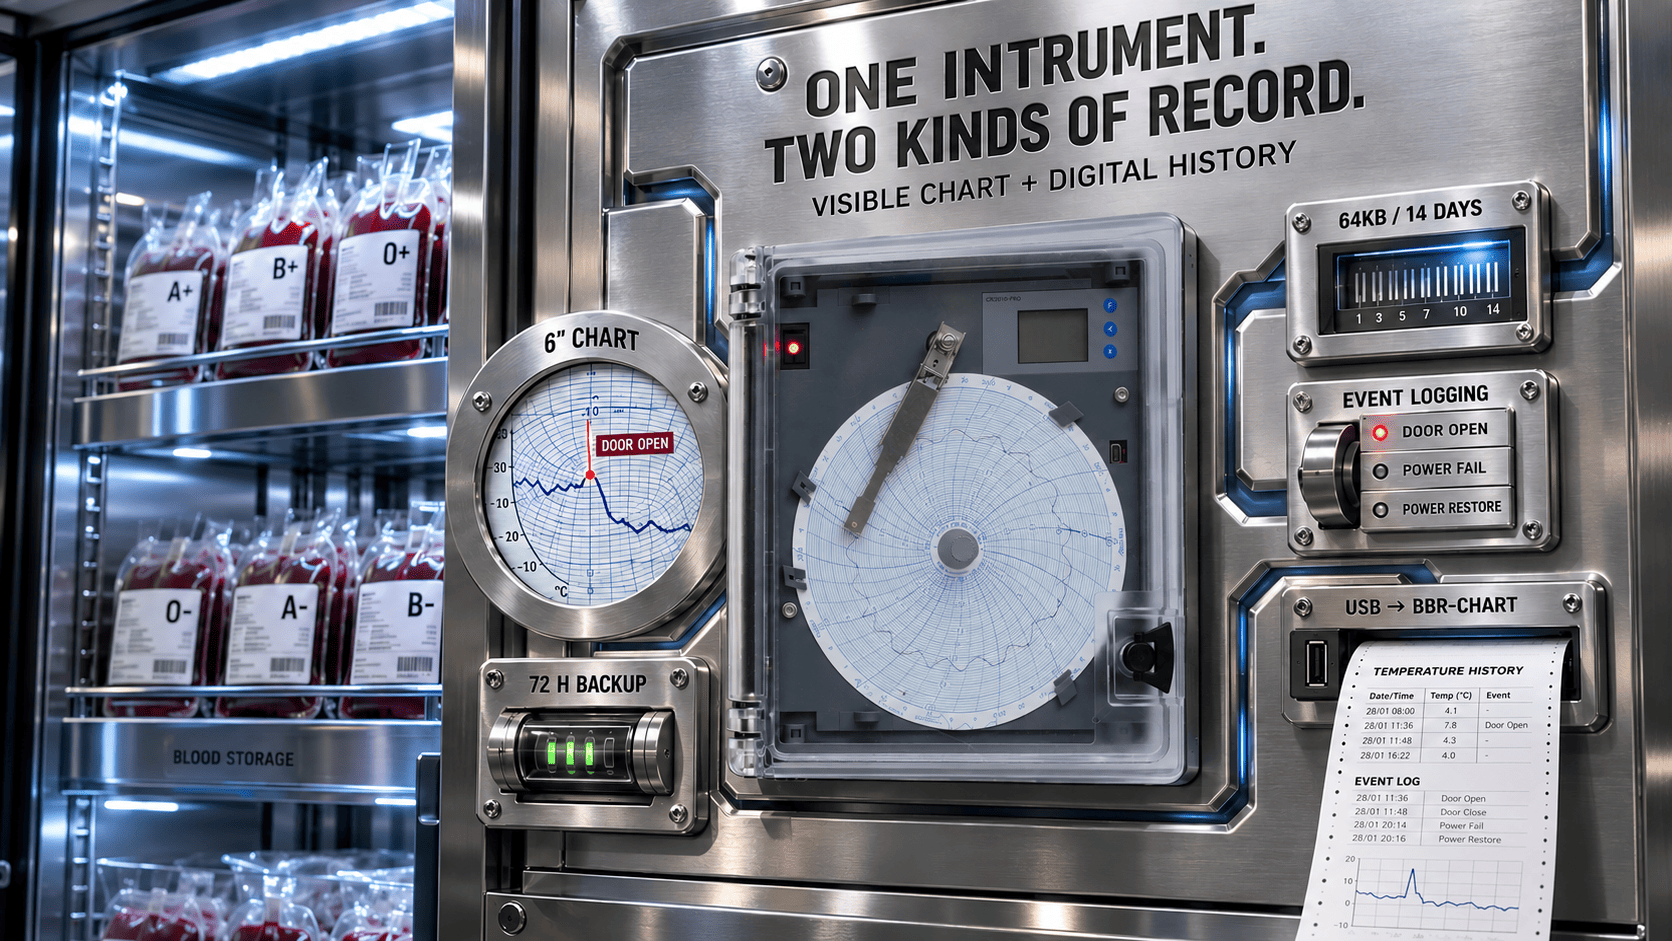
Circular chart recorder chart speed refers to how long a circular chart takes to complete one rotation, commonly 24 hours, 7 days, or 31 days.
A faster rotation spreads the trace over more paper and shows short events clearly. In contrast, a slower rotation compresses more time onto one chart but hides brief excursions.
The same three-hour excursion reads as a clear hump on a 24-hour chart and an almost invisible flicker on a 31-day one.
Same recorder. Same event. Completely different evidence.
Key Takeaways
Chart speed is how long one full rotation takes, typically 24 hours, 7 days, or 31 days.
Faster rotation gives more detail per hour and makes short excursions visible.
Slower rotation means fewer chart changes but compresses events into a small arc.
Choose by the shortest event you need to see, not by how often you want to change paper.
The chart must also match your recorder’s range, size, and rotation.
What Does Chart Speed Actually Change?
Chart speed changes how much paper each hour of recording occupies.
On a 24-hour chart, one hour spans a wide arc. However, on a 31-day chart, that same hour is compressed into a sliver. As a result, brief events become far harder to read.
On a circular recorder, time is the angular axis. The pen or stylus travels radially with temperature while the chart rotates once per period.
Speed up the rotation, and every hour gets more angular space. Slow it down, and a month folds into the same 360 degrees.
Nothing else about the instrument changes. The sensor, the accuracy class, and the working principle of the recorder all stay identical.
Only your resolution moves.
The Right Speed Is Set by the Shortest Event You Need to Prove
Choose chart speed by the shortest temperature event you need to see and defend.
If a two-hour excursion must be readable, a 31-day chart will not show it clearly, regardless of how convenient the change interval feels.
The honest decision logic:
24-Hour Chart Speed
Critical storage where short excursions carry consequences.
Blood bank units under NABH and Drugs & Cosmetics Act recording expectations, vaccine refrigerators, and validation runs.
Daily change.
7-Day Chart Speed
The practical middle ground for routine process and cold-storage monitoring under WHO GDP and ISO 9001 systems.
Weekly change.
31-Day Chart Speed
Slow-moving environments where only sustained trends matter.
Monthly change.
Here is the part nobody says out loud: convenience pushes almost everyone toward slower charts.
That is exactly where visibility quietly disappears.
If you are still shortlisting hardware, work through how to select a circular chart recorder before fixing the rotation.
Confirm the Chart Matches the Recorder, Not Just the Speed You Want
Check that the chart matches your recorder’s model, size, temperature range, and configured rotation.
A chart printed for a different range or rotation makes the trace unreadable, even when it physically fits.
This is where ordering matters.
G-Tek Corporation has been building circular chart recorders in Vadodara for over 30 years. It supplies charts printed to match the recorder’s size and temperature range across its rotation options.
Inkless models mark on pressure-sensitive paper. Therefore, a longer rotation never risks a dried pen mid-cycle.
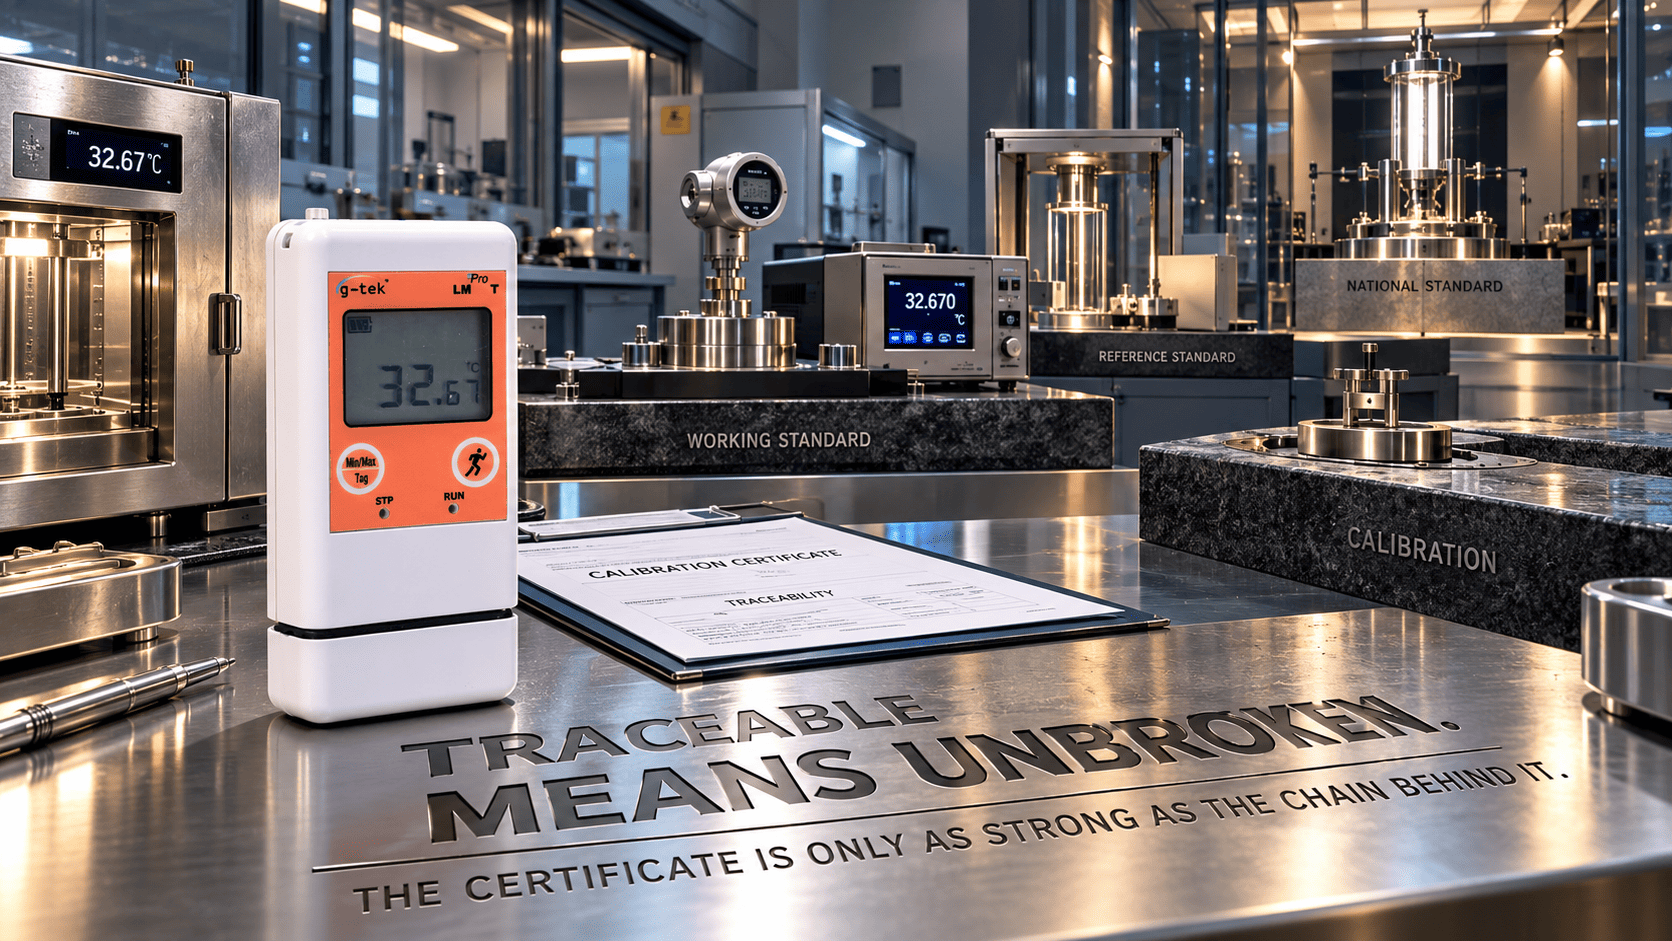
Additionally, every unit is calibrated in G-Tek’s own NABL ISO/IEC 17025-accredited laboratory.
Before You Order Charts – Verify These
Shortest event you must see: This sets the rotation, not convenience.
Recorder configuration: Is the recorder configured for that chart speed?
Chart range: Does it match the recorder range?
Chart size: 4″, 5″, 6″ or 11″ to suit the unit.
Chart replacement: Who changes the chart, and will a daily change realistically happen?
These checks help ensure the selected circular chart recorder chart speed matches your monitoring requirements.
Still mapping where each variant fits? See types, applications and functions of circular chart recorders.
Frequently Asked Questions
What Is Chart Speed on a Circular Chart Recorder?
Chart speed is how long the chart takes to complete one rotation, commonly 24 hours, 7 days, or 31 days
Which Chart Speed Should I Choose?
Choose by the shortest event you must see.
Critical storage suits 24-hour charts, routine monitoring suits 7-day charts, and slow environments suit 31-day charts
Why Are Short Excursions Hard to See on a 31-Day Chart?
A month compresses into one rotation. Therefore, a two-hour event occupies a tiny arc instead of a wide, readable section.
Does the Chart Have to Match the Recorder?
Yes. The chart must match the recorder’s model, size, temperature range, and configured rotation.
A mismatched chart makes the trace unreadable.
Where Is G-Tek Corporation Located?
Vadodara, Gujarat — manufacturing recording and monitoring instruments for over 30 years, with an in-house NABL-accredited calibration laboratory and pan-India support.
Pick the Speed That Shows What You Need to Prove
A chart you change less often stays convenient right up to the moment you need to show a three-hour excursion.
The rotation decides what the record can demonstrate.
Choosing the right circular chart recorder chart speed helps ensure the temperature events you need to prove remain visible on the chart.
Not sure which rotation suits your unit? Tell the G-Tek team what you are monitoring and the shortest event you need visible. Get a clear recommendation on chart speed and matching charts.
Related Reading
Related Posts