By Asutosh Shah & Alpesh Shah · Founders, G-Tek Corporation · 30+ years in temperature…
Data Logger Software: Turning Raw Readings Into a Report Someone Will Accept
By Asutosh Shah & Alpesh Shah · Founders, G-Tek Corporation · 30+ years in temperature monitoring, recording, and calibration instrumentation.
“We’ve got the data now what?”
It’s the question nobody asks before buying a logger, and everybody asks after.
The device did its job. It recorded faithfully, run after run. But a column of 8,000 readings isn’t a report, and the person waiting for it tomorrow morning doesn’t want raw numbers.
They want a graph, a table, a min-max summary, and something they can file.
Data logger software turns recorded readings into usable output by plotting them as a graph and listing them as a table with minimum, maximum, and average values.
It also exports the whole record as a PDF, Excel, or CSV file that can be filed, shared, or attached to a validation report.
Key Takeaways
A logger records data; the software is what turns it into a usable report.
Good software gives you the graph, the data table, and the summary values together.
Export formats matter: PDF to file and share, Excel or CSV to analyse further.
Buyers evaluate the logger carefully and the software not at all.
The reporting step is where the hours go, so check it before you order.
Judge the Logger by the Report It Produces, Not Just the Reading It Takes
Evaluate a data logger’s software as carefully as its accuracy. The software is what converts recorded readings into the graph, table, and exportable report your team and auditors actually use.
Accuracy decides whether the number is correct. Software decides whether anyone can use it.
A precise instrument paired with weak reporting still takes an afternoon of manual rebuilding every single time QA asks for a record.
That’s the gap most specification sheets never mention, and it’s the one your team lives with daily.
Before shortlisting, open the data logger range and ask what the download actually looks like.
What Should Data Logger Software Actually Give You?
At minimum, a trend graph, a full data table, summary values such as minimum, maximum, and average, and export options in PDF, Excel, and CSV.
This ensures one download covers both filing and further analysis.
Graph: See the shape of the run at a glance and spot an excursion instantly.
Table: Every reading with its time stamp, intact, for the record.
Summary: Min, max, and average calculated for you, not by hand.
PDF: File it, attach it, hand it over.
Excel / CSV: Analyse further or merge with other runs, the way a combined multi-logger validation report is built.
The Reporting Step Is Where the Time Actually Goes
Most of the effort in temperature monitoring isn’t recording the data. It’s producing the report afterwards.
That is why export quality affects your team’s workload more than almost any other feature.
This is the part G-Tek Corporation has refined over more than 30 years in Vadodara.
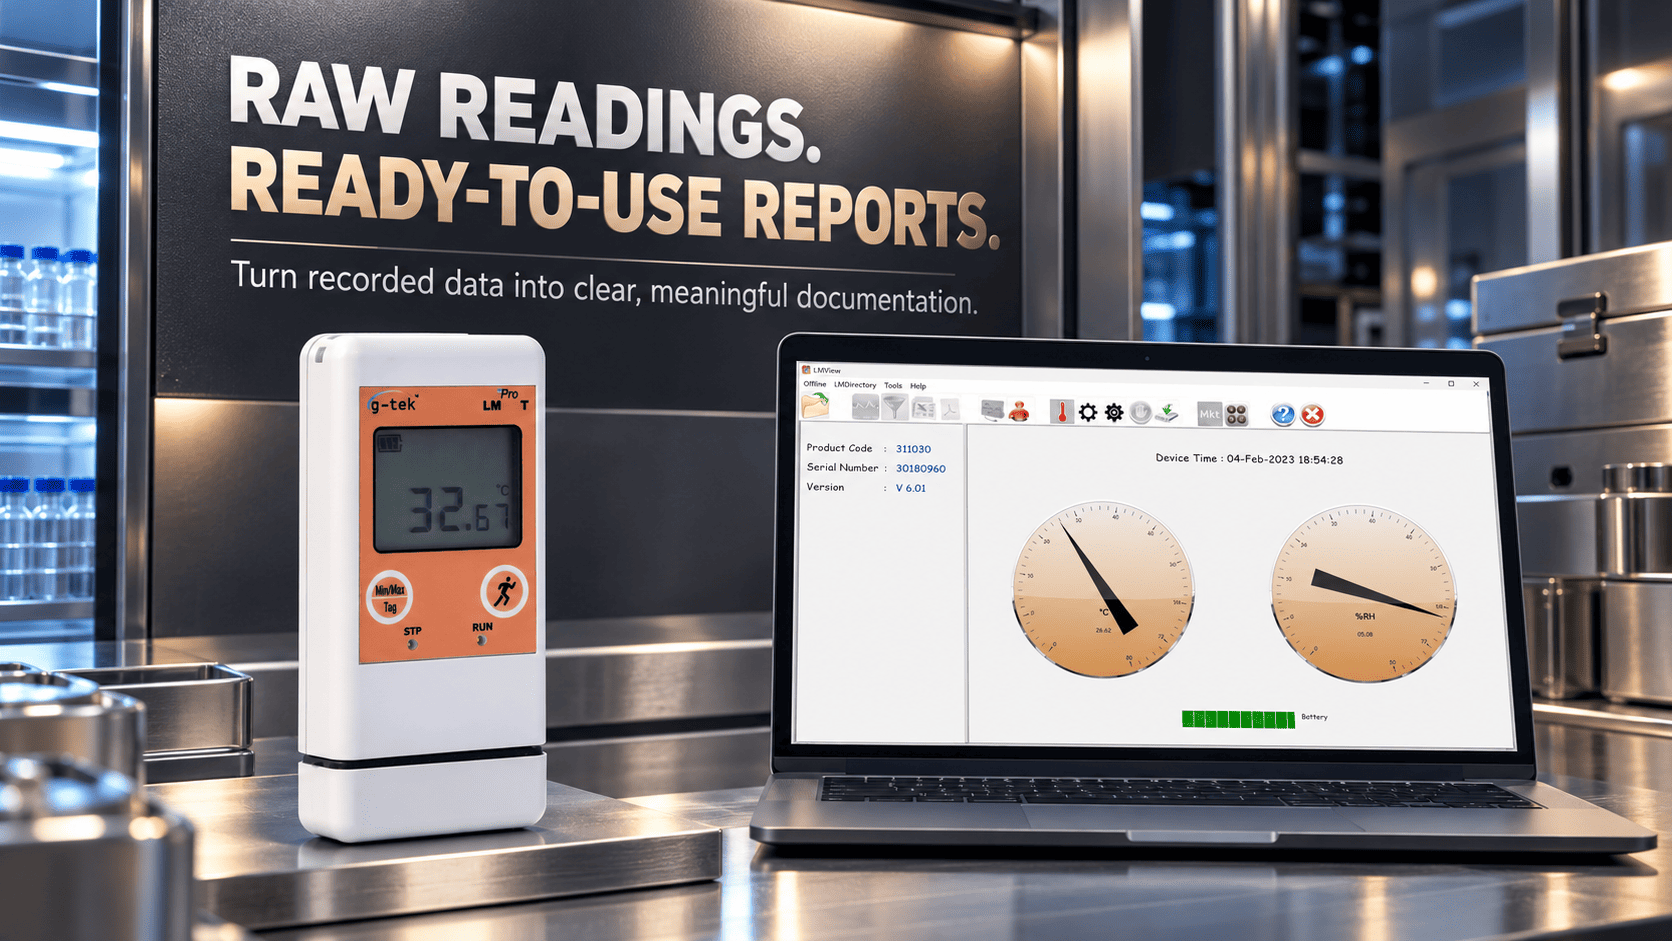
Its LM Pro and LM-XS loggers download through LmView. The software plots the run as a graph, lists the full data table, and exports the record as PDF, Excel, or CSV.
As a result, a completed run becomes a presentable report in a few clicks.
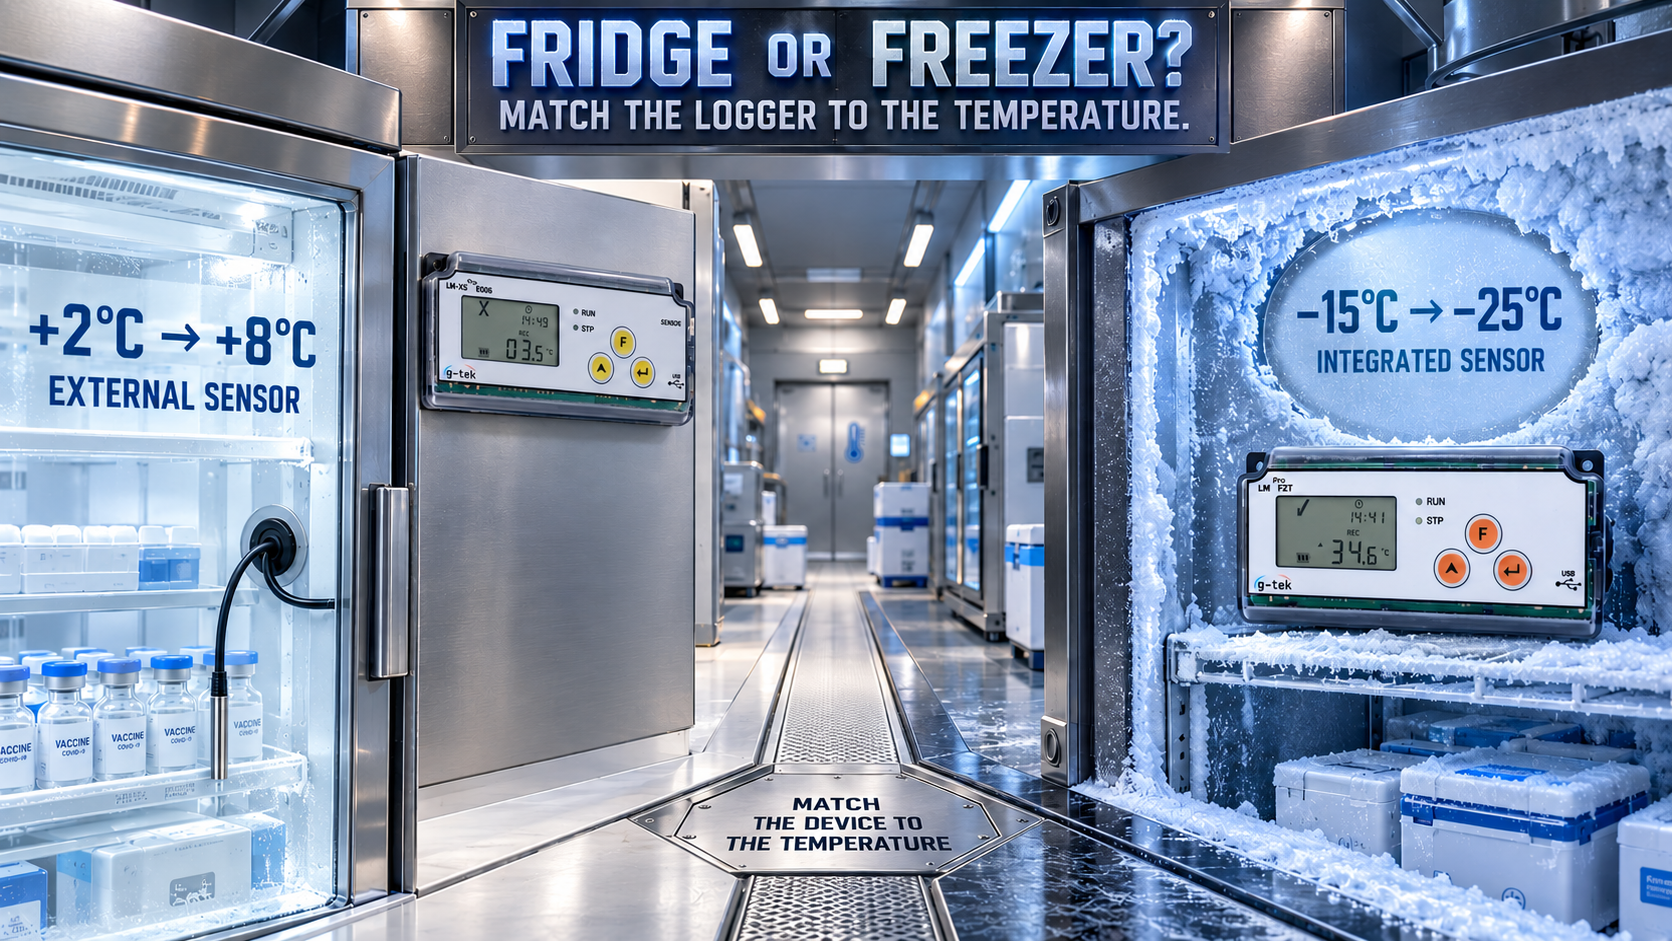
Dedicated versions such as LmViewE051 and LmViewXSE006 serve the WHO-PQS vaccine loggers.
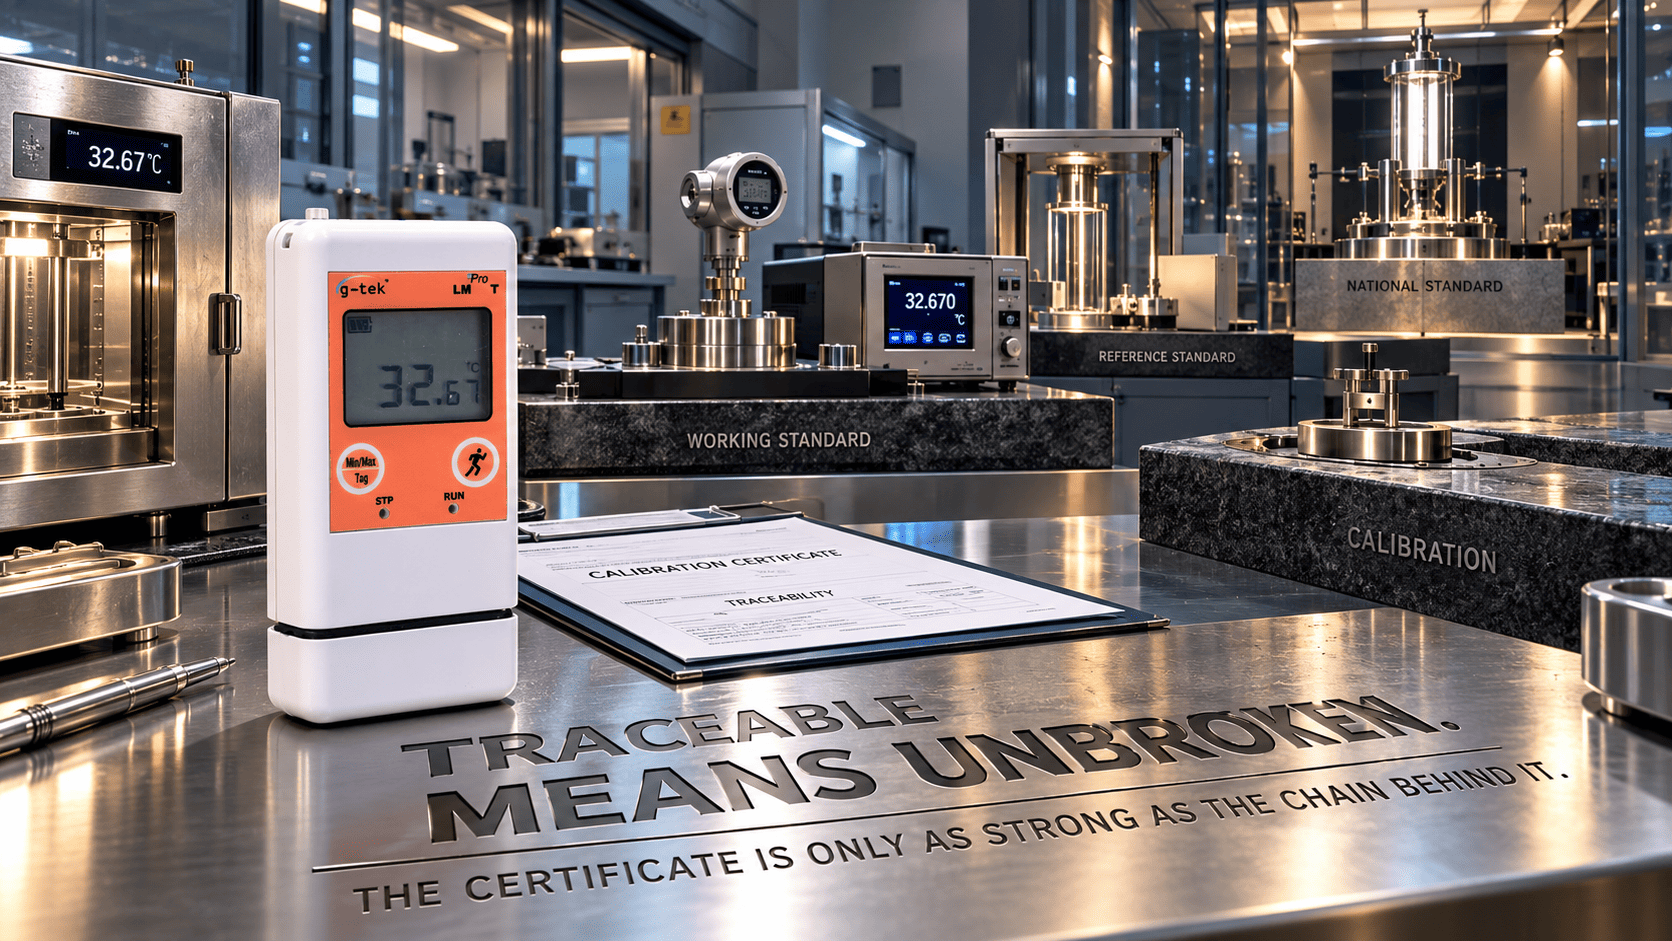
Additionally, every logger carries an individual NABL ISO/IEC 17025-traceable calibration certificate, so the numbers inside the report stand up when questioned.
See the full software range here. The same output drives a multi-logger mapping report.
Before You Choose a Logger, Check Its Software
Before selecting a data logger, check these important software features:
Export formats: PDF, Excel and CSV, or only one?
Summary values: Are min, max and average calculated for you?
Graph quality: Can you read the trend and spot an excursion?
Version match: Is there a dedicated build for your logger type?
Compliance: If regulated, is a 21 CFR Part 11 compliant version available, meeting EU GMP Annex 11 and ALCOA+ expectations? And is your calibration certificate still current?
These checks help you evaluate the reporting capabilities of data logger software before placing an order.
Frequently Asked Questions
What Does Data Logger Software Do?
It downloads recorded readings and turns them into a trend graph, a time-stamped data table, summary values, and an exportable report file.
Which Export Formats Should It Support?
PDF for filing and sharing, plus Excel or CSV for further analysis. All three together remove manual reformatting
Why Does Software Matter as Much as Accuracy?
Accuracy decides whether the reading is correct. Software decides whether anyone can use it without rebuilding it by hand.
What Software Do G-Tek Loggers Use?
LmView produces graphs, tables and PDF/Excel/CSV exports. Dedicated versions include LmViewE051 and LmViewXSE006 for WHO-PQS vaccine loggers.
Where Is G-Tek Corporation Located?
Vadodara, Gujarat — manufacturing monitoring instruments for over 30 years, with an in-house NABL-accredited calibration laboratory and pan-India support.
Buy the Report, Not Just the Reading
The logger takes the measurement. The software decides how long your team spends turning that measurement into something someone will accept.
Better checked before you order than after.
Choosing the right data logger software helps your team turn recorded readings into usable reports without unnecessary manual work.
Spending too long building reports by hand? Show the G-Tek team what reporting your records need and get a clear recommendation on the logger and software combination that produces it straight out.
Related Reading
Related Posts