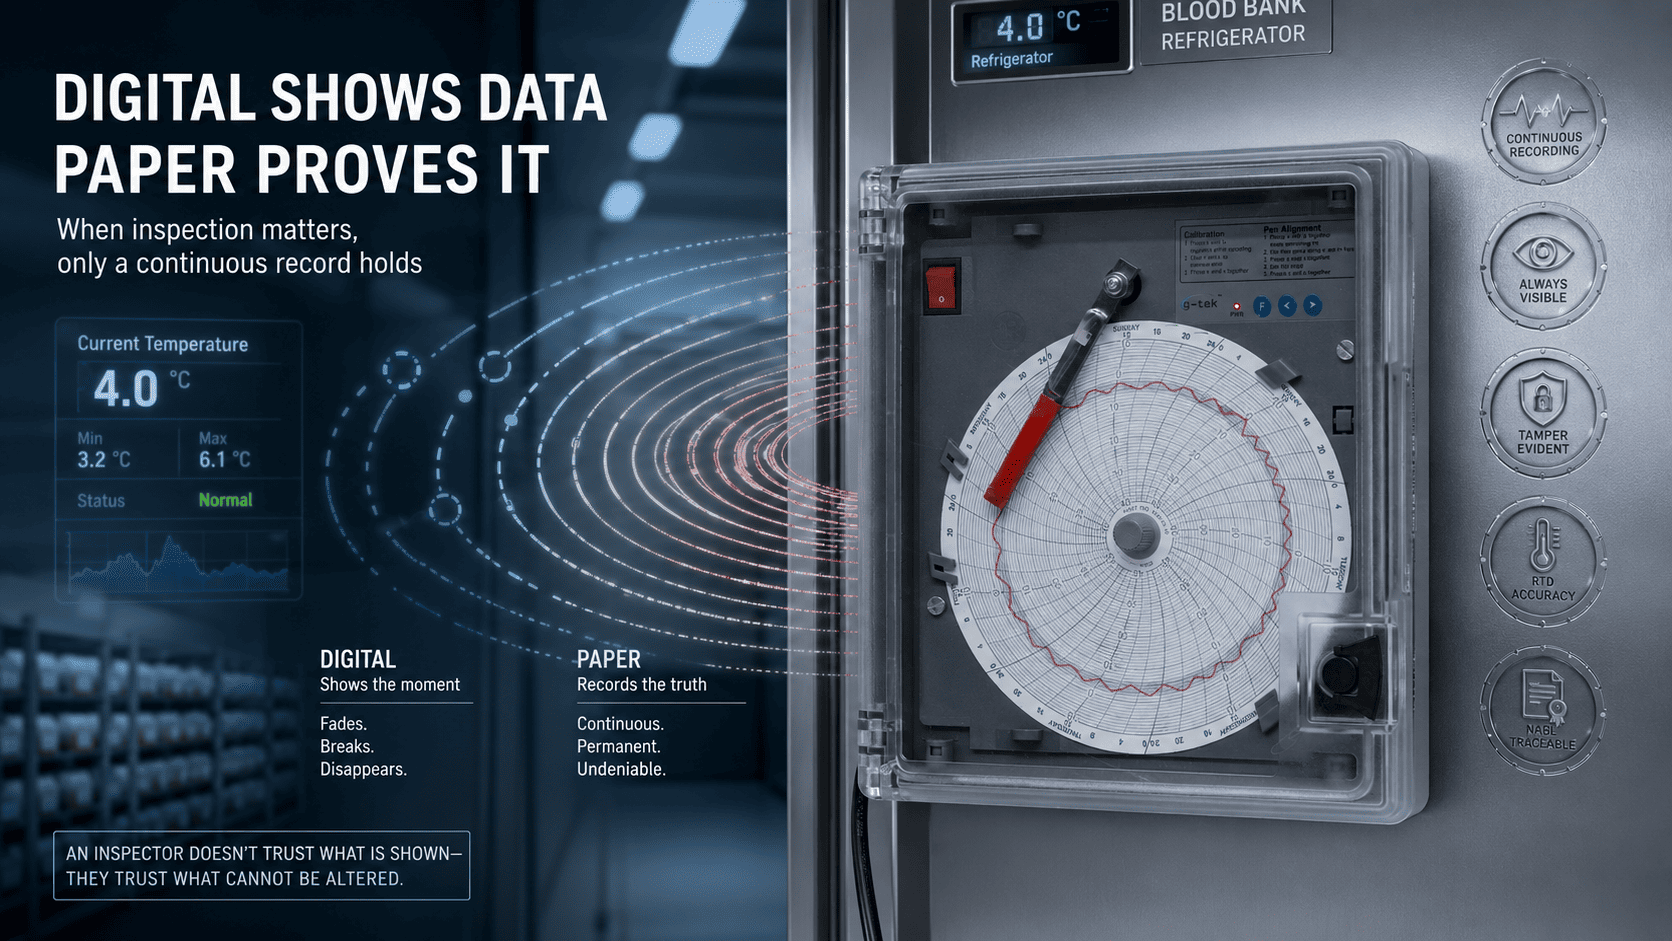
Blood banks still lean on circular chart recorders not because they're old-fashioned, but because a…
How Does a Circular Chart Recorder Work? From Sensor Reading to a Continuous Paper Trace
She’s new to the floor. Every shift, she walks past the circular chart recorder on the wall a paper disc turning almost imperceptibly, a pen tracing a quiet line across it, hour by hour.
She’s trusted that line all week. But she couldn’t tell you how the temperature becomes a pen movement, how the disc keeps time, or why the trace is difficult to alter.
If that’s you, you’re not alone.
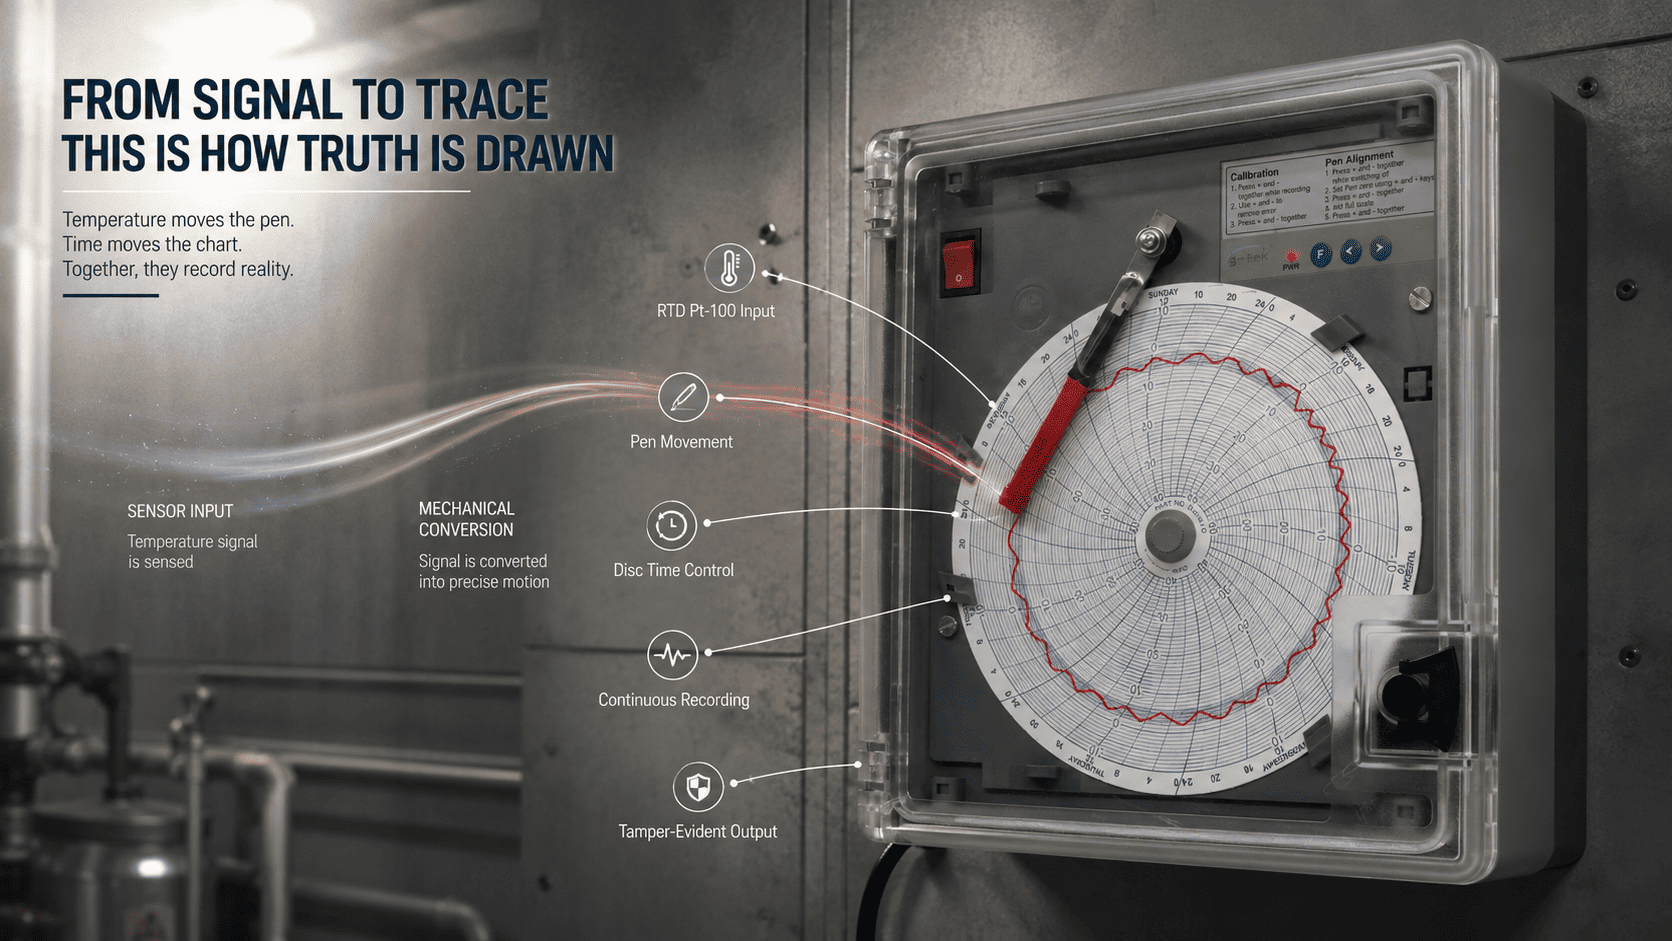
Understanding how a circular chart recorder works is actually quite simple. It turns a measured temperature into pen movement across a slowly rotating paper disc. The sensor drives the pen’s position, the disc keeps time, and together they draw a continuous, tamper-evident record of temperature over time with no computer involved.
🎯 Key Takeaways
- A circular chart recorder converts a sensor’s temperature reading into pen movement across a rotating chart.
- The RTD Pt-100 sensor determines how far across the chart the pen sits — that’s the temperature axis.
- The paper disc rotates at a set speed, often one rotation per day or week that’s the time axis.
- Pen position plus disc rotation draws one continuous line showing temperature over time.
- The physical, continuously drawn trace makes the record tamper-evident and easy to verify.
How Does a Circular Chart Recorder Turn Temperature Into a Line?
A circular chart recorder turns temperature into a line by using a sensor to control the pen’s position. As the measured temperature rises or falls, the pen moves in or out across the chart, tracing the temperature along the disc’s markings.
The sensor, typically an RTD Pt-100 (IEC 60751), measures the temperature. That reading is converted into a pen position along the chart’s temperature scale.
A higher temperature moves the pen one way, while a lower temperature moves it back. The pen’s radial position represents the measured value.
This is the same sensing principle you’ll find across G-Tek’s data loggers, just expressed on paper instead of a screen.
How Does the Circular Chart Recorder Keep Track of Time?
The chart keeps track of time by rotating the paper disc at a fixed speed, commonly one full rotation per day or per week. As the disc turns beneath the moving pen, the line spreads across the timeline.
A small motor rotates the disc steadily. That rotation speed sets the timescale, with 24-hour and 7-day charts among the common options.
As the disc turns under the pen, each angle of rotation corresponds to a particular time. So, the pen position tells you temperature, while the disc position tells you time. Together, they create one continuous trace.
Chart size matters here too. A 4-inch disc suits a compact panel, while an 11-inch disc provides more space to read fine movements clearly.
Pens may be traditional ink types or maintenance-free pressure pens that do not require ink refilling.
Why Is This Simple Recording Method Still Trusted?
Because the line is drawn physically and continuously. The paper trace provides a visible record directly at the unit, requires no computer to read, and makes later alterations easier to identify.
For a blood bank or a GMP process line, that visible and continuous record can be valuable for reviewing temperature history.
That combination of simplicity and evidence is why circular chart recorders remain in daily use. It is also why G-Tek Corporation, manufacturing recording instruments in Vadodara for over 30 years, continues to build a full range of circular chart recorders.
G-Tek units use an accurate RTD Pt-100 sensor to drive the pen and steady chart rotation to track time. Every unit is traceable to G-Tek’s own NABL ISO/IEC 17025-accredited calibration lab, supporting accurate and traceable temperature records.
The trace is only as reliable as the sensor and calibration behind it. That’s where recording accuracy is actually won.
Understand How a Circular Chart Recorder Works Before Choosing One
Once you understand how a circular chart recorder works, choosing the right model becomes simpler. The key is selecting the correct chart size, sensor, and pen for your application, backed by traceable calibration so every trace can be reviewed with confidence.
👉 Curious which chart recorder fits your application? Share what you’re recording and the unit it goes on with the G-Tek team and get a clear recommendation on the right recorder for the job.
Frequently Asked Questions
How does a circular chart recorder work?
A sensor moves the pen across the chart according to temperature, while a motor rotates the paper disc according to time. Together, they draw a continuous temperature-over-time record.
What does the pen position represent?
The pen’s position across the chart represents the measured temperature. As the value rises or falls, the pen moves accordingly on the rotating chart.
How does the chart record time?
The disc rotates at a fixed speed, often one rotation per day or week, so each position around the chart corresponds to a specific time.
Why are circular chart recorders tamper-evident?
The record is drawn physically and continuously on paper. This makes changes to the original trace easier to identify and allows the chart to be reviewed without a computer.
Where is G-Tek located?
G-Tek Corporation is based in Vadodara, Gujarat, and has been manufacturing recording instruments for over 30 years, backed by an in-house NABL-accredited calibration lab.
Related Posts