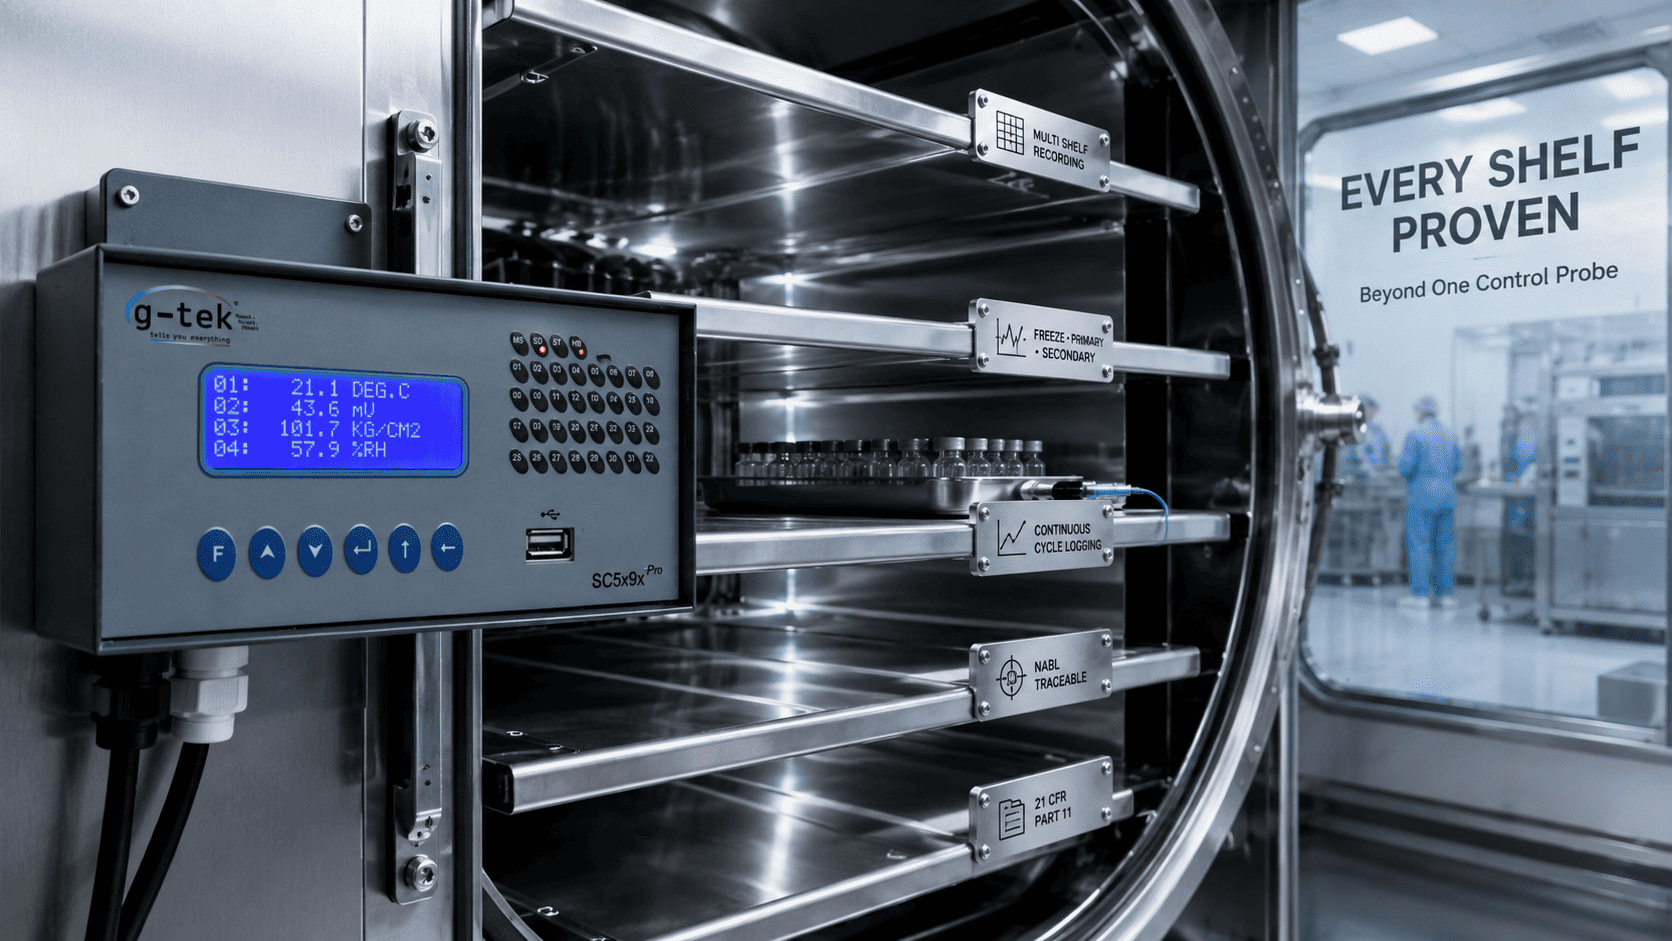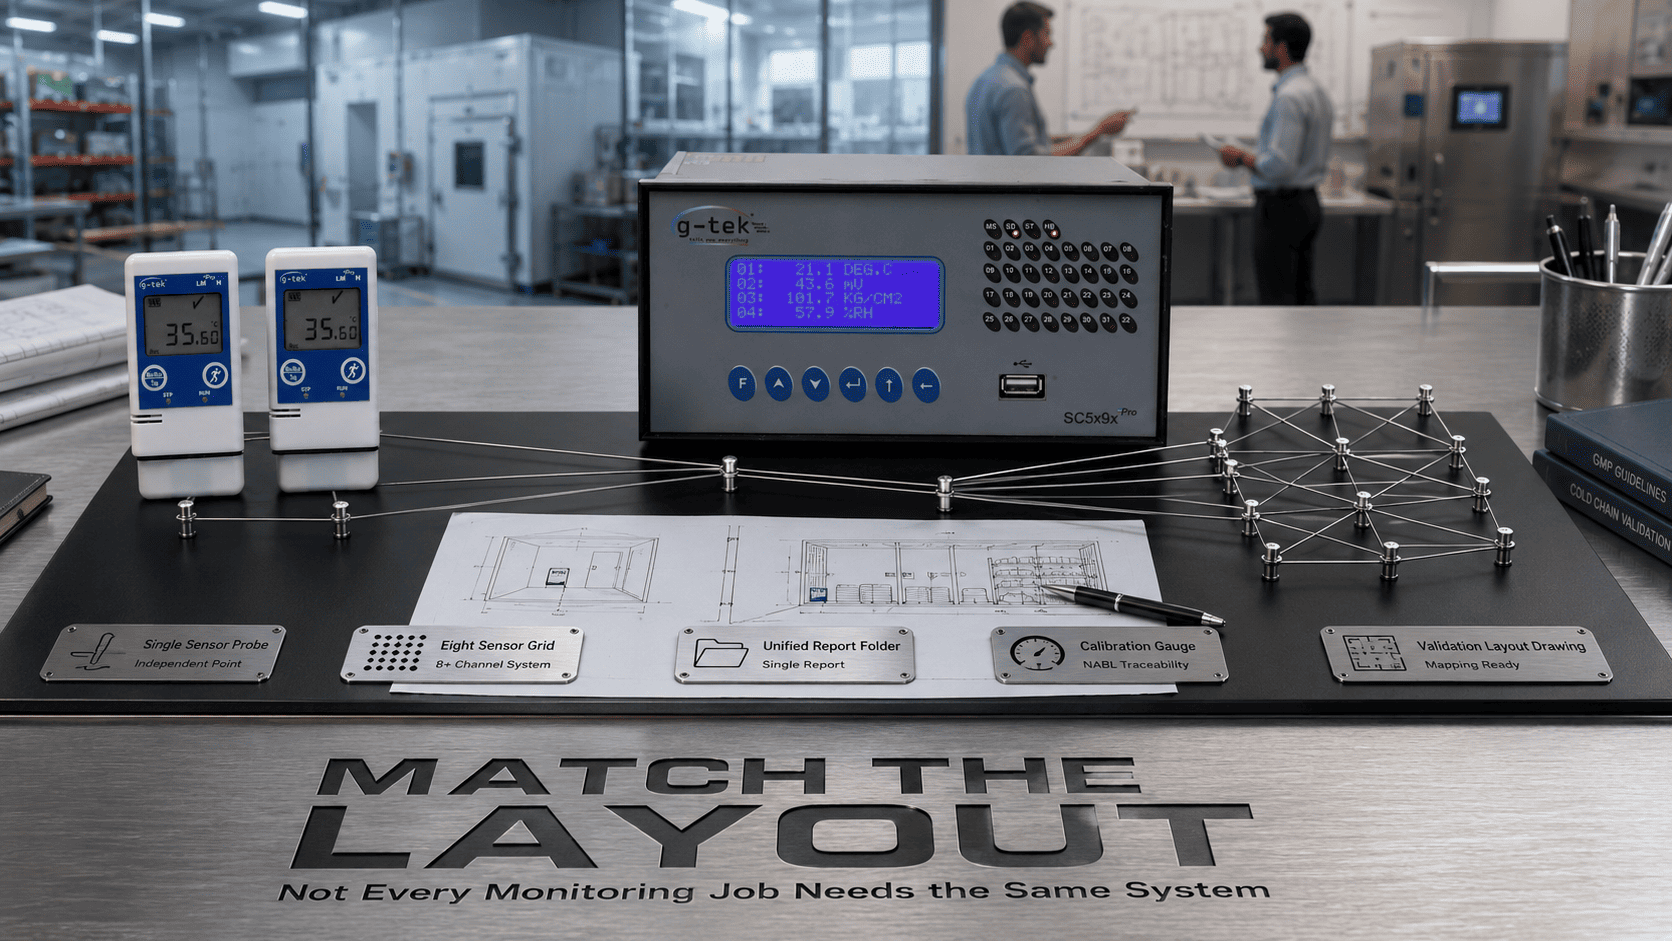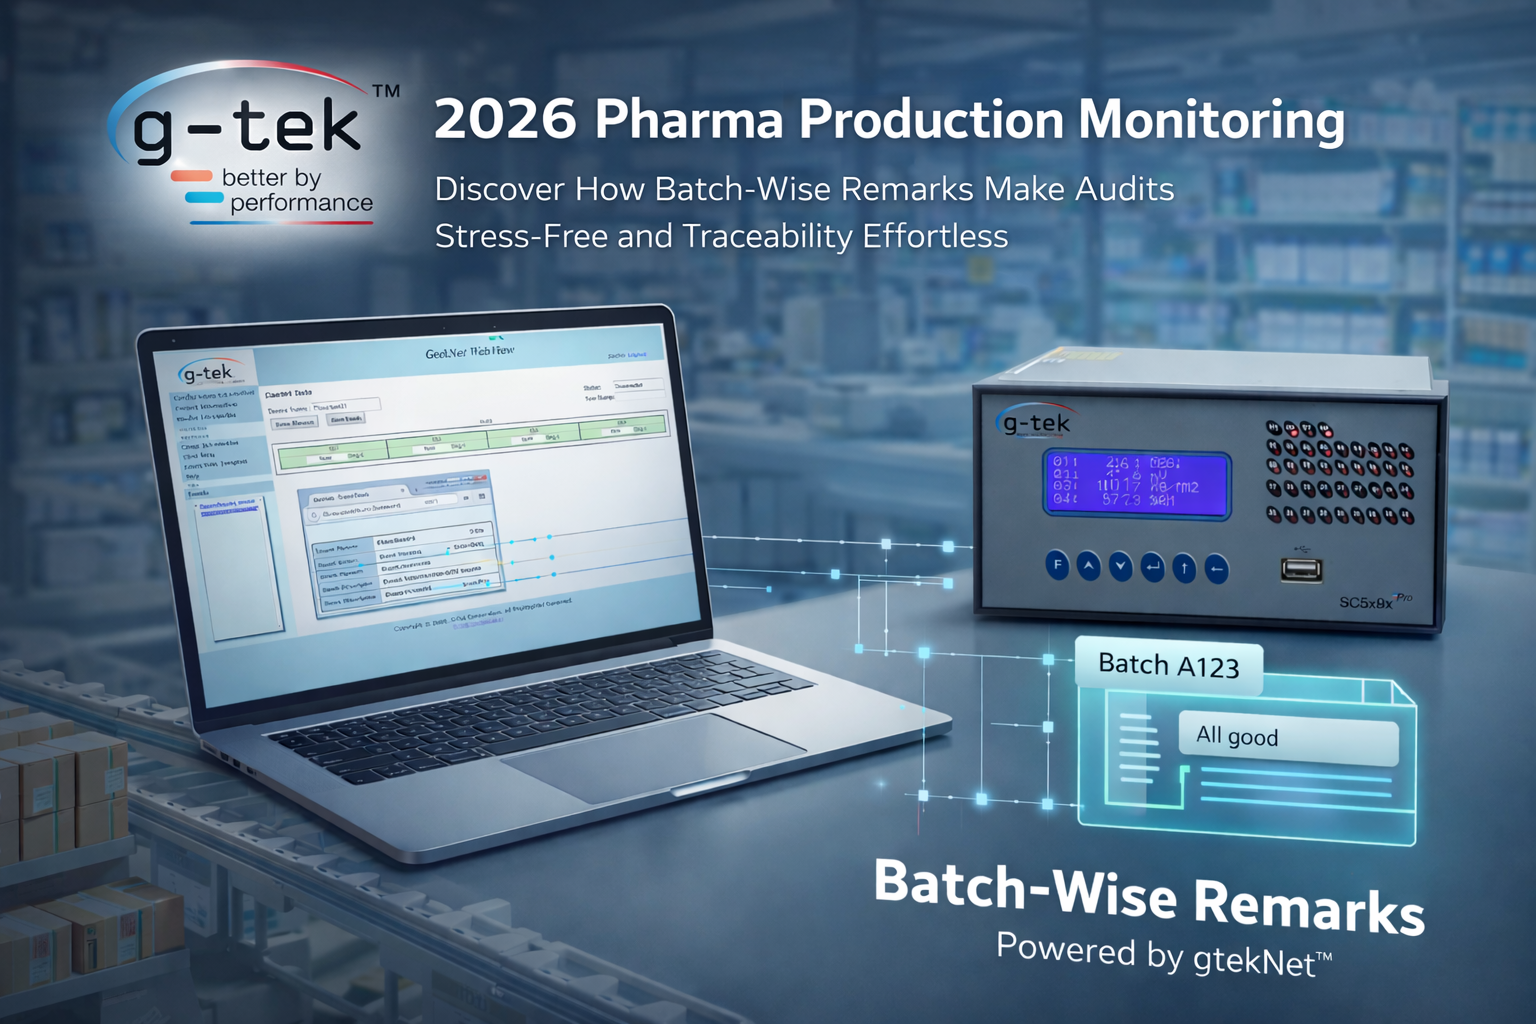
It's day two of a three-day lyophilization run. The operator glances at the controller. Everything…
50 Loggers, One Temperature Mapping Report: End the PDF Merge
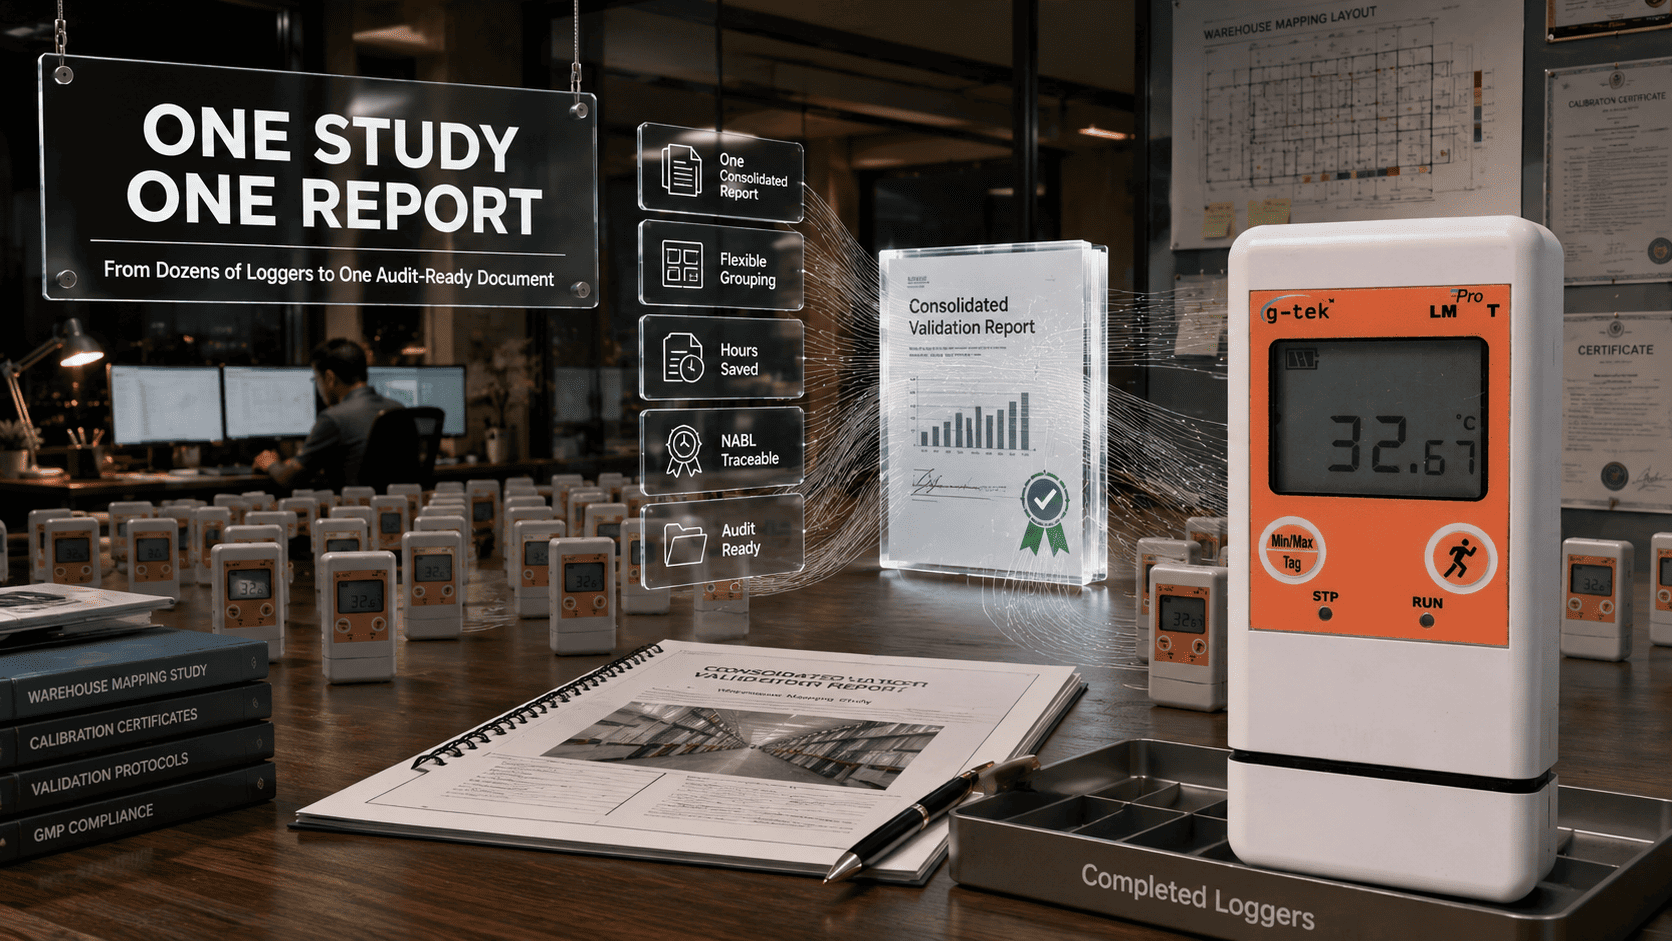
It’s 11 p.m. on a Friday. The warehouse mapping study wrapped six hours ago. Fifty loggers sit in a tray on the desk. And somewhere in the QA office, an engineer is still exporting them one file at a time, trying to stitch them into a single report before Monday’s audit.
One mistyped timestamp. The whole thing gets rechecked.
This is the part of thermal mapping nobody puts on the SOP: the merge.
In 2026, the hardest part of a large mapping study often isn’t placing the loggers. It’s turning their data into one temperature mapping report afterward. When a study runs 30, 50, or more loggers, consolidating them by hand is slow and error-prone.
🎯 Key Takeaways
- A large mapping study can run dozens of loggers, each producing a separate file to reconcile
- Merging logger files by hand is slow and introduces errors right before an audit
- Consolidated reporting turns an entire multi-logger study into one clean temperature mapping report
- Flexible grouping by 5, 15, or all at once lets teams report by room, zone, or full study
- The reporting software, not just the logger, is what saves hours on a large study
Why Is Reporting the Hardest Part of a Large Mapping Study?
Reporting is often the hardest part because every logger produces its own file. On a 50-logger warehouse study, that means 50 exports, 50 timestamp checks, and one very long night aligning everything into an audit-ready document.
The bottleneck sits at the end, after the study closes and someone has to build the compiled record the auditor will actually open.
For regulated or validated environments, the temperature mapping report should present the study data in a clear, traceable, and reviewable format.
What Should Reporting Software Do for a Multi-Logger Study?
It should consolidate multiple loggers into one temperature mapping report and let validation teams group the data the way their reports are actually structured.
Sometimes you need to show one room. That’s 5 loggers.
Sometimes a zone. That’s 15 loggers.
Sometimes the entire warehouse. All 50.
Rigid software can force teams to export and stitch files manually. Flexible software allows data to be grouped from a single dataset by room, zone, or full study.
How G-Tek’s LmView Turns a Whole Study Into One Report
This is exactly what G-Tek Corporation designed LmView to solve.
G-Tek built LmView to take an entire study of LM Pro T and LM Pro H loggers and compile the data into one consolidated temperature mapping report.
Validation teams can group loggers in fives, fifteens, or all at once, depending on whether the report needs to show a room, zone, or entire study.
Every logger behind that report is calibrated in G-Tek’s own NABL ISO/IEC 17025-accredited laboratory, so the consolidated dataset remains supported by traceable calibration.
Turn the Merge Into a Few Clicks
A consolidated temperature mapping report helps validation teams review the whole study in one place instead of managing dozens of separate files.
The report is where a study is won or lost on time.
👉 Running a big mapping study soon? Walk the G-Tek team through your logger count and how you need the report grouped, and see how LmView consolidates the whole study into one.
Frequently Asked Questions
Why is reporting difficult in a large mapping study?
Every logger can produce its own file. On a 50-logger study, merging them manually means aligning dozens of timestamps and datasets under audit pressure.
What should a temperature mapping report include?
A temperature mapping report should present the study data clearly and allow validation teams to review monitoring points, timestamps, zones, and relevant results in a traceable format.
Can I group loggers in a temperature mapping report by room or zone?
Yes. LmView can group logger data in fives, fifteens, or all at once.
Which G-Tek software consolidates a multi-logger study?
LmView consolidates data from LM Pro T and LM Pro H loggers into one grouped report.
Where is G-Tek Corporation located?
G-Tek is based in Vadodara, Gujarat, and has been manufacturing monitoring instruments since 1990, with additional reference material available through WHO
Related Posts